SlideShare uma empresa Scribd logo
1 de 19
Baixar para ler offline
7 0 | N A T U R E | V O L 5 5 6 | 5 a p r i l 2 0 1 8
Letter doi:10.1038/nature25029
A density cusp of quiescent X-ray binaries in the
central parsec of the Galaxy
Charles J. Hailey1
, Kaya Mori1
, Franz E. Bauer2,3,4
, Michael E. Berkowitz1
, Jaesub Hong5
& Benjamin J. Hord1
The existence of a ‘density cusp’1,2
—a localized increase in
number—of stellar-mass black holes near a supermassive black
hole is a fundamental prediction of galactic stellar dynamics3
. The
best place to detect such a cusp is in the Galactic Centre, where
the nearest supermassive black hole, Sagittarius A*, resides. As
many as 20,000 black holes are predicted to settle into the central
parsec of the Galaxy as a result of dynamical friction3–5
; however,
so far no density cusp of black holes has been detected. Low-mass
X-ray binary systems that contain a stellar-mass black hole are
natural tracers of isolated black holes. Here we report observations
of a dozen quiescent X-ray binaries in a density cusp within one
parsec of Sagittarius A*. The lower-energy emission spectra that
we observed in these binaries is distinct from the higher-energy
spectra associated with the population of accreting white dwarfs that
dominates the central eight parsecs of the Galaxy6
. The properties
of these X-ray binaries, in particular their spatial distribution and
luminosity function, suggest the existence of hundreds of binary
systems in the central parsec of the Galaxy and many more isolated
black holes. We cannot rule out a contribution to the observed
emission from a population (of up to about one-half the number of
X-ray binaries) of rotationally powered, millisecond pulsars. The
spatial distribution of the binary systems is a relic of their formation
history, either in the stellar disk around Sagittarius A* (ref. 7) or
through in-fall from globular clusters, and constrains the number
density of sources in the modelling of gravitational waves from
massive stellar remnants8,9
, such as neutron stars and black holes.
The Chandra X-ray Observatory has accumulated 1.4 ×​ 106
 s
of observations of the Galactic Centre using the Advanced CCD
Imaging Spectrometer I (ACIS-I) over the past 12 years. Owing to the
high concentration of X-ray sources in the Galactic Centre (such as
Sagittarius A*​(hereafter Sgr A*​) and IRS 13) and the emission from
hot gas, we restrict our analysis to angular distances of more than
5″​from Sgr A*​, which correspond to projected distances r of more than
0.2 pc assuming an 8-kpc distance to the Galactic Centre10
. From these
Chandra observations, 415 X-ray point sources at projected distances of
0.2 pc <​ r <​ 3.8 pc from Sgr A*​were identified in the 2–8-keV energy
band, and used for all analysis. Point sources were ignored if they were
in diffuse regions such as filamentary structures or molecular clouds,
were too close to very bright point sources or were previously known
to have large X-ray outbursts. A net count (source minus background
counts) limit of C ≥​ 100 (equivalent to a flux of 2 ×​ 10−15
 erg cm−2
 s−1
)
was used for the analysis. This count limit corresponds to a point source
detection significance of 4σ. There are 92 sources with C ≥​ 100, 26 of
which lie at r <​ 1 pc. For spectral fitting, a limit of C ≥​ 200 was used
in order to constrain spectral parameters effectively: 13 sources with
r <​ 1 pc met this criterion. This is too few sources for population
analysis, so we instead use a hardness ratio of X-ray colour, or slope,
HR2 =​ (CH −​ CL)/(CH +​ CL), where CL and CH are, respectively, the
net counts from the source in the 2–4-keV (low) and 4–8-keV (high)
energy bands. Previous Chandra analysis11
and simulations reported
here demonstrate that the thermal emission of magnetic cataclysmic
variable stars—which have typical temperatures of kT ≈​ 8–40 keV—in
the Chandra energy band of 0.5–8 keV is well modelled by a single-
temperature, optically thin thermal plasma and an iron line
­complex at an energy of E =​ 6–7 keV. By contrast, black-hole and
­neutron-star binaries and pulsars are universally characterized by
non-­thermal power-law emission with a flux described by F(E) =​ kE−Γ
 
photons cm−2
 s−1
 keV−1
, where E is the photon energy in keV and
Γ ≈​ 1.5–2 (ref. 12) is the photon index. The low- and high-energy bands
for HR2 were chosen to maximally separate thermal and non-thermal
sources. Thermal sources have HR2 values of more than 0.3, whereas
non-thermal sources have HR2 values of less than 0.3.
In Fig. 1a, b we show the HR2 distributions for sources with C ≥​ 100
that lie in the circle r <​ 1 pc and in the annulus 1 pc <​ r <​ 3.8 pc, respec-
tively, centred on Sgr A*​. A second source population clearly appears
at r <​ 1 pc in the range −​0.1 <​ HR2 <​ 0.3. Integrating the HR2 distri-
bution in the annular region for HR2 <​ 0.3, we would expect at most
one source with HR2 <​ 0.3 for r <​ 1 pc if the sources in the inner region
are drawn from the same HR2 distribution as that for the sources in the
annulus; however, there are 12 such sources.
The diffuse, hard X-ray emission in the Galactic Centre, which
­dominates the inner 8 pc of the Galaxy6
, is due to unresolved magnetic
cataclysmic variable stars (in particular, a sub-class known as interme-
diate polars) with optically thin thermal emission of kT ≈​ 8–40 keV
(ref. 13). These intermediate polars are the origin of the HR2 >​ 0.3
population. The newly identified HR2 <​ 0.3 population is prominent
only inside the central parsec.
Before concluding that the HR2 probability distribution in the inner
parsec is due to a newly identified source population, we studied the
confounding effects of the high concentration of gas and dust in the
Galactic Centre. The high dust column density could preferentially
scatter soft X-rays or lead to the well-known degeneracy between
the spectral hardness and interstellar absorption of a source14
. Both
of these effects could alter the HR2 distribution near Sgr A*​. They
can be probed using a second, lower-energy-band hardness ratio to
produce colour–colour plots, so-called quantile diagrams, and spectral
simulations of thermal and non-thermal sources. All of these analyses
demonstrate that the HR2 <​ 0.3 sources cannot be HR2 >​ 0.3 sources
masquerading as apparent HR2 <​ 0.3 sources as a result of scattering
or column-density effects (see Methods).
The stacked spectra of the HR2 <​ 0.3 and HR2 >​ 0.3 sources in the
inner parsec are compared in Fig. 2. The comparison provides further
confirmation of the spectrally distinct nature of the HR2 <​ 0.3 sources
in the inner parsec. The HR2 >​ 0.3 sources are well fitted by a thermal
spectrum with partially covered absorption to account for an accretion
curtain and scattering from the surface of a white dwarf—a model that
is commonly applied to intermediate polars. The best-fitting
­temperature ( = . − .
+ .
kT 6 3 keV1 7
1 6
, where the errors here and elsewhere
1
Columbia Astrophysics Laboratory, Columbia University, 550 West 120th Street, Room 1027, New York, New York 10027, USA. 2
Instituto de Astrofísica, Facultad de Física, Pontificia Universidad
Católica de Chile, 306, Santiago 22, Chile. 3
Millennium Institute of Astrophysics, Vicuña Mackenna, 4860, 7820436 Macul, Santiago, Chile. 4
Space Science Institute, 4750 Walnut Street, Suite 205,
Boulder, Colorado 80301, USA. 5
Harvard-Smithsonian Center for Astrophysics, 60 Garden Street, MS-83, Cambridge, Massachusetts 02138, USA.
© 2017 Macmillan Publishers Limited, part of Springer Nature. All rights reserved.
Letter RESEARCH
5 a p r i l 2 0 1 8 | V O L 5 5 6 | N A T U R E | 7 1
correspond to one standard deviation) is consistent not only with the
temperatures of the HR2 >​ 0.3 sources at 1 pc <​ r <​ 3.8 pc, but also
more generally with the low-temperature component of the (unre-
solved) hard X-ray emission and the typical Chandra-measured
­temperature found for magnetic cataclysmic variable stars in the
Galactic Centre15
. By contrast, the stacked spectrum of the HR2 <​ 0.3
sources in the inner parsec is well fitted (with a reduced chi-squared of
χ = .ν
0 812
for 51 degrees of freedom (d.o.f.)) by a non-thermal
­power-law withΓ = . − .
+ .
1 9 0 3
0 3
 , with no sign of neutral or ionized iron lines
in the spectrum. A final confirmation of the newly identified, spectrally
distinct source population in the inner approximately 1 pc comes from
the 13 sources in the central parsec that are bright enough (C ≥​ 200) to
enable spectral fitting. The HR2 <​ 0.3 sources are well fitted with a
non-thermal spectrum and the HR2 >​ 0.3 sources with an intermediate-
polar thermal model (see Methods for discussion and Extended Data
Fig. 1 for examples).
The spatially distinct morphology of this newly identified source
population is shown in Fig. 3, with the HR2 <​ 0.3 sources concentrated
in the central parsec and the HR2 >​ 0.3 sources extended over the
region of the diffuse, hard X-ray emission. The newly identified popu­
lation is not extragalactic because the number of background active
galactic nuclei (about 0.1)16
is negligible within the inner approximately
1 pc above the 2–8-keV flux threshold. The non-thermal spectrum,
with Γ ≈​ 1.5–2 and lacking iron lines, clearly distinguishes this popu-
lation from the population of thermally emitting intermediate polars
that dominate at larger radii. We rule out neutron-star, low-mass X-ray
binaries as candidates for the newly identified population because of
the short recurrence time of about 5–10 years between their large X-ray
outbursts. The continuous monitoring of the Galactic Centre for more
than a decade is believed to have revealed all such binaries17,18
, and
none of the point sources discussed here has ever produced an ­outburst.
High-mass X-ray binaries comprise about 40% of all Galactic X-ray
binaries12
and, given the large concentration of O and B stars in the cen-
tral parsec19
, are potential contributors to the newly identified source
population. However, infrared surveys that cover all of the Chandra
X-ray sources in the Galactic Centre are able to rule out massive stellar
companions20,21
, from bright O or B supergiants down to the faintest of
the Be high-mass X-ray binaries (spectral class B2V), effectively elimi­
nating the possibility of a contribution of high-mass X-ray binaries.
Coronally active isolated stars and stellar binaries having soft thermal
spectra (corresponding to HR2 <​ −​0.3) are not observed among our
sources in the central approximately 1 pc; in addition, their expected
luminosities are well below the Chandra detection threshold. During an
outburst they may have harder X-ray spectra, but would still be below
the Chandra detection threshold, and their numbers are substantial
only in the inner approximately 0.1 pc (ref. 22).
The most plausible explanation for the non-thermal sources in the
inner parsec is that they are quiescent black-hole low-mass X-ray
­binaries (qBH-LMXBs). Although qBH-LMXBs can exhibit ­modest
variability23
, there is limited information about their long-term var-
iability, so steady emission from qBH-LMXBs cannot be ruled out.
Timing analysis of the non-thermal sources in the inner parsec
over the 12 years of observations shows that 6 out of 12 of them are
­variable, whereas the remaining 6 are steady. Rotation-powered
−1.0 −0.5 0 0.5 1.0
HR2
0
1
2
3
4
5
6
7
8
Frequency
r < 1 pc r > 1 pc
a b
−1.0 −0.5 0 0.5 1.0
HR2
0
5
10
15
20
25
30
Figure 1 | Hardness ratio (HR2) distribution of X-ray point sources
with net counts of C ≥ 100 at a projected radial distance from Sgr A*.
a, Sources for r <​ 1 pc. b, Sources for 1 pc <​ r <​ 3.8 pc. A substantial
population of sources with −​0.1 <​ HR2 <​ 0.3 appears for r <​ 1 pc (a). Of
the 66 sources in the annulus (b), 2 (3%) have HR2 <​ 0.3, whereas of the 26
sources in the inner circle (a), 12 (46%) have HR2 <​ 0.3. A Kolmogorov–
Smirnov test shows that the HR2 cumulative distribution function of the
annular region is not consistent with that of the circular region (D =​ 0.528;
P =​ 3.0 ×​ 10−5
). The two outliers in b, at HR2 =​ −​0.56 and HR2 =​ −​0.74,
were included in the Kolmogorov–Smirnov test. They account for at
most one HR2 <​ 0.3 source in a, with a probability of about 2%. A χ2
test
based on the lack of spatial constancy in HR2 between 1 pc <​ r <​ 3.8 pc
and r <​ 1 pc also indicates a different source population for r <​ 1 pc
(P =​ 1.1 ×​ 10−19
). The Kolmogorov–Smirnov test, outliers and the χ2
test
(Extended Data Fig. 3) are further discussed in Methods.
a b
Count(s–1keV–1)
10−5
5 × 10⁻⁶
2 × 10⁻⁵
5 × 10⁻⁵
5
−2
0
2
Energy (keV)
10−5
5 × 10⁻⁶
2 × 10⁻⁵
5 × 10⁻⁵
5
−2
0
2
Energy (keV)
HR2 > 0.3 HR2 < 0.3
Figure 2 | Stacked Chandra spectra for X-ray sources within the inner
parsec. a, Sources with HR2 >​ 0.3. b, Sources with HR2 <​ 0.3. The
HR2 >​ 0.3 spectrum (a) for the 8 sources with strong Fe lines is well
fitted by an optically thin, thermal plasma model with temperature
= . − .
+ .
kT 6 3 keV1 7
1 6
(χ = .ν
1 252
for 36 d.o.f.). A power-law model yields a poor
fit (χ = .ν
1 902
for 39 d.o.f.; Γ = . − .
+ .
0 7 0 5
0 5
). The 6 sources with weak or no Fe
lines have a comparable best-fit photon index of Γ = . − .
+ .
0 6 0 4
0 4
). These
photon indices are typical of intermediate-polar spectra fitted with a
power-law model in the Chandra energy bandpass11,13
. The HR2 <​ 0.3
spectrum (b) is well fitted by a power-law model with a significantly softer
photon index (Γ = . − .
+ .
1 9 0 3
0 3
for 51 d.o.f.). Stacked spectra of the 14
HR2 >​ 0.3 sources (Extended Data Fig. 7) were fitted to a thermal plasma
model with the best-fit temperature = . − .
+ .
kT 7 3 keV1 3
3 0
(χ = .ν
0 802
for 58
d.o.f.), the typical Chandra-measured temperature (about 7–9 keV) for
magnetic cataclysmic variables in the Galactic Centre6
. The error bars
represent 1σ statistical uncertainties. The bottom panels show residuals
(data minus model) in terms of 1σ significance. For more details on the
stacked spectra analysis, see Methods.
© 2017 Macmillan Publishers Limited, part of Springer Nature. All rights reserved.
LetterRESEARCH
7 2 | N A T U R E | V O L 5 5 6 | 5 a p r i l 2 0 1 8
­millisecond pulsars (rMSPs) also have non-thermal emission consistent
with HR2 <​ 0.3. However, rMSPs are always steady over timescales
of months to years24
, so we cannot rule out that up to one-half of the
non-thermal sources that we observe in the inner parsec are rMSPs.
In Fig. 4 we show the surface density of the 12 non-thermal sources
as a function of projected radius from Sgr A*​, from which we extract
a three-dimensional cusp power-law index. The cusp index does not
change in a statistically significant fashion if the six qBH-LMXB can-
didates are analysed separately from the six rMSP candidates (see
Methods for discussion). Owing to the complexities of the formation
and evolution of BH-LMXBs, the agreement with the isolated black-
hole prediction is probably coincidental. However, the concentration
of black holes in the inner approximately 1 pc (well inside the influence
radius at r ≈ 3 pc) that we observe has been predicted previously3
. In
Extended Data Fig. 2 we show the logN–logS (number versus X-ray
flux) for the qBH-LMXB candidate sources with r <​ 1 pc and down to
the Chandra flux limit. A power-law fit to the logN–logS distribution
(N(>​S) =​ kS−α
, α= . − .
+ .
1 8 0 2
0 2
) can then be extrapolated to the minimum
flux of the local, known BH-LMXB population (see Methods) to give
600–1,000 qBH-LMXBs (1σ error on the fit) if all of the observed
HR2 <​ 0.3 sources are qBH-LMXBs, and 300–500 if one-half of them
are rMSPs. The lack of large outbursts from individual sources over
more than a decade suggests outburst recurrence times of about 1,000
years, for which there is some theoretical motivation (see Methods).
If the density cusp extends to Sgr A*​, then the qBH-LMXB counts
must be corrected for the un­­observed volume inside 0.2 pc. For the best-
fitting α and three-­dimensional cusp index γ, this correction would
increase the total number of qBH-LMXBs for r <​ 1 pc by about 50%.
To estimate an upper limit for the total number of rMSPs we use a
previous result6
, obtained by using the measured correlation between
the spin-down power E and the X-ray luminosity LX for a large sample
of rMSPs, that the fraction of rMSPs above the Chandra flux threshold
at the Galactic Centre is about 3%. We therefore set an upper limit of
approximately 200 for the number of rMSPs in the Galactic Centre.
Our estimated number of BH-LMXBs is a lower limit for the ­number
of isolated black holes in the Galactic Centre. The total number of low-
mass X-ray binaries is consistent with a previous estimate25
based on
three-body exchange formation in in-falling globular clusters; however,
it has been argued26
that this previous estimate is an overestimate by
10–100. If that is the case, then it is most likely that the black-hole
binaries were formed via the tidal capture of old, low-mass stars (either
orbiting Sgr A*​or formed in the surrounding stellar disk), and the
observed number of BH-LMXBs necessitates the existence of more
than about 10,000 isolated black holes (A. Generozov, B. Metzger,
N. Stone and J. Ostriker, manuscript in preparation).
Online Content Methods, along with any additional Extended Data display items and
Source Data, are available in the online version of the paper; references unique to
these sections appear only in the online paper.
received 15 September 2016; accepted 6 November 2017.
1.	 Bahcall, J. N. & Wolf, R. A. Star distribution around a black hole in a globular
cluster. Astrophys. J. 209, 214–232 (1976).
2.	 Bahcall, J. N. & Wolf, R. A. Star distribution around a black hole in a globular
cluster. II. Unequal star masses. Astrophys. J. 216, 883–907 (1977).
3.	 Miralda-Escude, J. & Gould, A. A cluster of black holes at the Galactic Center.
Astrophys. J. 545, 847–853 (2000).
4.	 Morris, M. Massive star formation near the Galactic Center and the fate of the
stellar remnants. Astrophys. J. 408, 496–506 (1993).
5.	 Freitag, M. & Amaro-Seoane, P. Stellar remnants in galactic nuclei: mass
segregation. Astrophys. J. 649, 91–117 (2006).
6.	 Perez, K. et al. Extended hard X-ray emission in the inner few parsecs of the
Galaxy. Nature 520, 646–649 (2015).
7.	 Levin, Y. & Beloborodov, A. M. Stellar disk in the galactic center — a remnant of
a dense accretion disk? Astrophys. J. 590, L33–L36 (2003).
8.	 Antonini, F. & Rasio, F. A. Merging black hole binaries in galactic nuclei:
implications for Advanced-LIGO detections. Astrophys. J. 831, 187
(2016).
1 5 17 37 65 101 145 196 257 324 400
Figure 3 | Chandra 2–8-keV image of the Galactic Centre with X-ray
sources with C ≥ 100 overlaid. Thermal (HR2 >​ 0.3) and non-thermal
(HR2 <​ 0.3) sources are indicated with red and cyan circles, respectively.
The colour scale indicates the number of 2–8-keV counts per pixel. The
inner and outer yellow circles delineate the 0.2 pc <​ r <​ 1 pc region around
Sgr A*​. The inner region was excluded from the analysis. The magenta
ellipse (7.8 pc ×​ 3.9 pc, full-width at half-maximum) bounds the region of
spatially unresolved hard X-ray emission that was discovered by NuSTAR
and is due to thermal emission from intermediate polars. The non-thermal
sources cluster inside the inner parsec, whereas the thermal sources are
distributed more uniformly throughout the hard X-ray emission. The
Galactic plane runs along the semi-major axis of the ellipse. The dearth of
sources to the north of the Galactic plane is due to strong extinction from
molecular clouds (such as the circumnuclear disk), which densely populate
that region27
. This may reduce the estimated number of sources by a factor
of a few. Some bright sources without circles are X-ray transients, including
the outbursting neutron-star low-mass X-ray binary AX J1745−​2901 in
the lower right corner. For reference, Chandra’s angular resolution is
0.5 arcsec, which corresponds to about 0.025 pc at the Galactic Centre.
Projected radius from Sgr A* (pc)
Surfacedensity(pc–2)
1
10
1
Figure 4 | Surface density of the 12 non-thermal sources as a function of
projected radius from Sgr A*. Sources with C ≥​ 100 and C ≥​ 50 are
indicated in black and red, respectively. The cusp power-law index γ of the
non-thermal sources (HR2 <​ 0.3) was obtained by using an assumed three-
dimensional form for the source density of n(r) =​ kr−γ
and projecting this
along the line-of-sight radius R to obtain a best fit to the surface density
Σ(R) =​ kR−β
. The best fit yields γ = . − .
+ .
2 4 0 3
0 3
. The isolated black-hole cusp
around Sgr A*​is predicted to have a power-law index γ in the approximate
range 1.3–2.3 (refs 26, 28–30). The red histogram is for sources with
C ≥​ 50 and gives a crude estimate of the surface density at larger radii,
although it may suffer from mild contamination from spurious
background sources. The best-fitting power-law index in this case is
γ = . − .
+ .
2 0 0 2
0 2
. There is no statistically significant difference in the power-law
index if the six rMSP candidates are removed from the analysis. See
Methods for more details of the cusp analysis.
© 2017 Macmillan Publishers Limited, part of Springer Nature. All rights reserved.
Letter RESEARCH
5 a p r i l 2 0 1 8 | V O L 5 5 6 | N A T U R E | 7 3
9.	 O’Leary, R. M., Kocsis, B. & Loeb, A. Gravitational waves from scattering of
stellar-mass black holes in galactic nuclei. Mon. Not. R. Astron. Soc. 395,
2127–2146 (2009).
10.	 Reid, M. J. The distance to the center of the Galaxy. Annu. Rev. Astron.
Astrophys. 31, 345–372 (1993).
11.	 Muno, M. P. et al. A catalog of X-ray point sources from two megaseconds of
Chandra observations of the Galactic Center. Astrophys. J. Suppl. Ser. 181,
110–128 (2009).
12.	 Remillard, R. A. & McClintock, J. E. X-ray properties of black-hole binaries.
Annu. Rev. Astron. Astrophys. 44, 49–92 (2006).
13.	 Hailey, C. J. et al. Evidence for intermediate polars as the origin of the Galactic
Center hard X-ray emission. Astrophys. J. 826, 160 (2016).
14.	 Hong, J., Schlegel, E. M. & Grindlay, J. E. New spectral classification
technique for X-ray sources: quantile analysis. Astrophys. J. 614, 508–517
(2004).
15.	 Muno, M. P. et al. The spectra and variability of X-ray sources in a deep Chandra
observation of the Galactic Center. Astrophys. J. 613, 1179–1201 (2004).
16.	 Kim, M. et al. Chandra multiwavelength project X-ray point source number
counts and cosmic X-Ray background. Astrophys. J. 659, 29–51 (2007).
17.	 Degenaar, N. et al. The Swift X-ray monitoring campaign of the center of the
Milky Way. J. High Energy Astrophys. 7, 137–147 (2015).
18.	 Degenaar, N. et al. A four-year XMM-Newton/Chandra monitoring campaign in
the Galactic Centre: analysing the X-ray transients. Astron. Astrophys. 545, A49
(2012).
19.	 Bartko, H. et al. An extremely top-heavy IMF in the Galactic Center stellar disks.
Astrophys. J. 708, 834–840 (2010).
20.	 Mauerhan, J. C. et al. Near-infrared counterparts to Chandra X-ray sources
toward the Galactic Center. I. Statistics and a catalog of candidates. Astrophys.
J. 703, 30–41 (2009).
21.	 Laycock, S. et al. Constraining the nature of the Galactic Center X-ray source
population. Astrophys. J. 634, L53–L56 (2005).
22.	 Sazonov, S., Sunyaev, R. & Revnivtsev, M. Coronal radiation of a cusp of
spun-up stars and the X-ray luminosity of Sgr A*​. Mon. Not. R. Astron. Soc. 420,
388–404 (2012).
23.	 Plotkin, R. M. et al. The X-ray spectral evolution of galactic black hole X-ray
binaries toward quiescence. Astrophys. J. 773, 59 (2013).
24.	 Bogdanov, S. et al. Chandra X-Ray observations of 19 millisecond pulsars in
the globular cluster 47 Tucanae. Astrophys. J. 646, 1104–1115 (2006).
25.	 Muno, M. P. et al. An overabundance of transient X-ray binaries within 1 parsec
of the Galactic Center. Astrophys. J. 622, L113–L116 (2005).
Acknowledgements This work was partially supported by NASA contract no.
NNG08FD60C. We thank P. Broos of the Chandra ACIS Instrument Team at
Penn State for help with the ACIS Extract Package, and D. P. Huenemoerder and
H. M. Guenther at MIT for help with the MARX simulation tool. We acknowledge
C. Jin and G. Ponti for providing the dust scattering model. We thank
A. Generozov, D. Helfand, L. Hui, S. Mandel, B. Metzger, J. Ostriker and
N. Stone of Columbia University and Q. D. Wang at the University of
Massachusetts at Amherst for discussions. F.E.B. acknowledges support
from CONICYT-Chile (Basal-CATA PFB-06/2007, FONDECYT Regular 1141218),
the Ministry of Economy, Development, and Tourism’s Millennium Science
Initiative through grant IC120009, awarded to The Millennium Institute of
Astrophysics, MAS.
Author Contributions C.J.H., statistical and population analysis, interpretation
and manuscript preparation; K.M., image and spectral analysis, interpretation
and manuscript preparation; F.E.B., source extraction, MARX simulations and
review; M.E.B., image, spectral and statistical analysis, MARX simulations and
review; J.H., source extraction, MARX simulations and review; and B.J.H., image,
spectral and population analysis, XSPEC simulations and review.
Author Information Reprints and permissions information is available at
www.nature.com/reprints. The authors declare no competing financial interests.
Readers are welcome to comment on the online version of the paper. Publisher’s
note: Springer Nature remains neutral with regard to jurisdictional claims in
published maps and institutional affiliations. Correspondence and requests for
materials should be addressed to C.J.H. (chuckh@astro.columbia.edu).
Reviewer Information Nature thanks F. Baganoff, J. Miralda-Escudé and
M. Morris for their contribution to the peer review of this work.
26.	 Hopman, C. Binary dynamics near a massive black hole. Astrophys. J. 700,
1933–1951 (2009).
27.	 Christopher, M. H. et al. HCN and HCO+
observations of the Galactic
circumnuclear disk. Astrophys. J. 622, 346–365 (2005).
28.	 Alexander, T. & Hopman, C. The effect of mass segregation on gravitational
sources near massive black holes. Astrophys. J. 645, L133–L136 (2006).
29.	 Alexander, T. & Hopman, C. Strong mass segregation around a massive black
hole. Astrophys. J. 697, 1861–1869 (2009).
30.	 Merritt, D. The distribution of stars and stellar remnants at the Galactic Center.
Astrophys. J. 718, 739–761 (2010).
© 2017 Macmillan Publishers Limited, part of Springer Nature. All rights reserved.
LetterRESEARCH
Methods
We used data from the Chandra X-ray Observatory (CXO). Following previous
survey analyses11
only data from the ACIS-I instrument were used. There were
45 observations pointing at or near Sgr A*​providing a total cleaned exposure of
1.4 Ms. This is a 40% increase in exposure time over the most recent and updated
(hereafter Muno) source catalogue11
, although all of the sources we analysed are
listed in the Muno catalogue. 1σ errors are quoted for parameter uncertainties
throughout the paper.
Point source selection. We selected all point sources in the Muno catalogue within
a circle of radius r =​ 100″​(about 4 pc) centred on Sgr A*​. We checked to ensure that
these point sources were not embedded in X-ray filaments or molecular clouds.
We excluded all known sources of transient outbursts such as neutron-star low-
mass X-ray binaries (NS-LMXBs). The region at r <​ 5″​(less than about 0.2 pc)
was also excluded because of very high background contamination and owing to
the ­complex X-ray morphology that enhanced difficulties with isolating the true
properties of the point sources; this region includes Sgr A*​, the IRS 13 star-forming
complex and PWN G359.96−​0.04. This left 415 point sources from the catalogue
out to r <​ 100″​. Sources with C ≥​ 200 (41 sources, 10%) after background subtrac-
tion could be spectrally fitted individually. Analysis with hardness ratio (colour)
was possible for sources with C ≥​ 50 (211 out of 415, 51%). However, most of our
analysis was done for sources with C ≥​ 100, because it is increasing difficulty to
distinguish between hard and soft sources as the count rate decreases.
Source and background extraction. For each source, ACIS Extract (AE)
­(version AE 2016Sept22; ref. 31) was used to extract source photons from a
circle containing 90% of the encircled energy fraction (EEF), typically with
1″​radius, centred on each source. All available observations from years
2003–2014 were used. For each Chandra observation, AE provides event and
image files for the source, spectral files including source and background spectra,
response matrix and effective area files, and light curves. We investigated various
methods of background extraction and adopted the following source/background
extraction methodology as optimal (and later validated by our MARX simulations)
in the crowded Galactic Centre region where background is not spatially uniform.
For background subtraction, AE defines an inner annulus at 1.1 times the 99% EEF
radius (typically 2.5″​) so that source photons from the wings of the point spread
function do not strongly contaminate background estimates. The outer radius of
the background annulus is increased until the ratio of its area to the area of the
source extraction region reaches an optimum preset value (= 5) as recommended
in AE. The outer radius of the background annulus can vary over a range of about
3.5″ to 5″ because as additional sources are encountered from the inputted region
source list, AE automatically excludes those sources and subsequently increases
the outer radius until the optimum preset value of background-to-source area ratio
is reached. After AE processing, we further excluded point sources with very high
background counts (usually from other nearby point sources) from our analysis.
Extended Data Fig. 4 illustrates our source and background extractions for one of
the 12 soft sources (source 5 in Extended Data Table 1) located in the Rockefeller
Ridge, the most source-crowded region we analysed.
Spectral analysis. We applied four different methods of spectral analysis: the
Chandra-defined hardness ratio (such as X-ray colour or slope) HR2 =​ (CH −​ CL)/
(CH +​ CL), where CH and CL are the net counts in the 2–4-keV and 4–8-keV bands,
respectively; colour–colour diagrams using HR2 and HR3 =​ (CH −​ CL)/(CH +​ CL),
where CH and CL are now the net counts in the 1–3-keV and 5–8-keV bands;
spectral fitting of individual sources, with net count C ≥​ 200; and spectral fitting
of stacked source spectra. We performed all spectral fitting and calculated hardness
ratios using XSPEC version 12.932
. We adopted the tbabs model and the previously
reported33
abundance data to take into account interstellar absorption. In addi-
tion, the Chandra simulation tool (MARX version 5.3.1) was used ­extensively34
.
MARX allows simulated sources with pre-defined spectra to be added directly
into the multiple-observation Chandra data that we analysed, with their actual
backgrounds, in the Galactic Centre. MARX was used to simulate non-thermal
power-law spectra to assess efficiency for recovering the proper photon index
and hardness ratios as a function of source brightness, in the actual Chandra
Galactic Centre data. Finally, the standard XSPEC simulation tool fakeit was used
to ­determine HR2 and HR3 for various source spectra, to investigate the effects of
dust scattering on hardness ratios and power-law photon indices and to investigate
any degeneracy between photon index determination and column density.
Hardness ratio analysis. We use hardness ratio analysis to determine whether the
point source population is composed of spectrally distinct components. Hardness
ratios permit assessment of spectral properties of fainter sources than would be
­possible with spectral fitting. Previous work15
has established that HR2 is an
­effective diagnostic for distinguishing magnetic cataclysmic variables (mCVs)
with thermal spectra from millisecond pulsars, neutron-star binaries and black-
hole binaries with non-thermal spectra. mCVs are known to emit as an optically
thin plasma of approximate temperature 8–40 keV with an accompanying iron-line
­complex at E ≈​ 6–7 keV (ref. 13). This is in contrast to the populations of millisecond
pulsars, neutron-star binaries and black-hole binaries, which exhibit their true
non-thermal power-law spectra with photon indices of Γ ≈​ 1–2.5 (refs 12, 23).
On the basis of simulations of Chandra spectra, we adjusted the energy bands of
HR2 so that the largest distinction between the thermal and non-thermal models
could be obtained. Our resultant definition of HR2 differs slightly from that used
previously15
. HR2 =​ 0.3 was adopted as the dividing line between the thermally
emitting mCVs (HR2 >​ 0.3) and the non-thermal source populations (HR2 <​ 0.3).
Because higher HR2 corresponds to spectrally harder sources, mCVs appear harder
in the Chandra bandpass even though they have thermal spectra. More recent
work6,13,35
has shown that the mCVs in the Galactic Centre are in fact completely
dominated by a sub-class of mCV called intermediate polars (IPs); henceforth, we
use that designation for the thermal source population characterized by HR2 >​ 0.3.
We performed XSPEC simulations to establish the conversion from photon index
to HR2, for a range of neutral hydrogen column densities typical of the Galactic
Centre ((6–17) ×​ 1022
cm−2
; refs 36, 37). XSPEC simulations were also used to
determine at what HR2 typical IPs with kT ≈​ 8–40 keV would appear. For this
simulation, we chose four canonical IPs (V709 Cas, NY Lup, V1223 Sgr and TV
Col), representative of a range of plasma temperatures and neutral hydrogen
column densities associated with an accretion curtain at the distance of the Galactic
Centre (8 kpc)10
. In all cases the IPs had HR2 >​ 0.3. For reference, HR2 =​ 0.3
corresponds to Γ =​ 1.5 for non-thermal spectra with a hydrogen column density of
NH =​ 14 ×​ 1022
cm−2
, the median of the range of values in the Galactic Centre. This
Γ is typical for the majority of NS- and BH-LMXBs, and rMSPs12,23,38
.
The HR2 distribution for 1 pc <​ r <​ 3.8 pc has two extreme outliers (CXO
J174540.20−​285900.8 and CXO J174537.98−​290134.5), at HR2 values of
− . − .
+ .
0 74 0 13
0 13
and− . − .
+ .
0 56 0 09
0 09
, respectively. These sources are not considered to be
IPs or non-thermal sources (see below), but they cannot be excluded from the
Kolmogorov–Smirnov (KS) test because they lie in a range of HR2 where, with
their errors, they could contribute to the r <​ 1 pc HR2 distribution. However,
because these are the only two outliers at HR2 <​ 0.3, out of the 66 sources for
1 pc <​ r <​ 3.8 pc, there can be at most 1 out of the 12 HR2 <​ 0.3 sources for r <​ 1 pc
that arises from the 1 pc <​ r <​ 3.8 pc population. This is an extremely conservative
estimate. Using the errors on the two HR2 outliers and on all of the r <​ 1 pc sources,
there is only an approximately 2% chance that even one of the HR2 <​ 0.3 sources
for r <​ 1 pc is from the same source population(s) as the 1 pc <​ r <​ 3.8 pc sources.
Given the results of the KS test, we performed a parametric test to confirm that
the source population for r <​ 1 pc is different from that (or those) for
1 pc <​ r <​ 3.8 pc. Extended Data Fig. 3 shows the radial distribution of HR2 for the
sources with C ≥​ 100 as a function of projected distance from Sgr A*​. The errors
on the HR2 determination are normally distributed, as determined by simulations,
so a standard χ2
test can be applied to test for the constancy (expected for an IP
population) of HR2 as a function of distance from Sgr A*​. Fitting a function
HR2(r) =​ constant to the data for r >​ 1 pc yields the best-fitting HR2 of 0.59. The
fact that the reduced χ2
value (χ = .ν
1 392
for 63 d.o.f.) exceeds 1 suggests that the
spectral hardness data are intrinsically scattered, probably owing to the spread of
the IP temperature distribution, which is typically in the range kT ≈​ 8–40 keV. We
estimated the systematic errors associated with the intrinsic HR2 distribution of
r >​ 1 pc sources by taking the Gaussian quadrature difference between the total
variances and the statistical errors. We found that the systematic errors (about 8%)
are subdominant compared to the statistical errors (about 20%). To test the
­hypothesis of a bifurcation in the HR2 distribution at r <​ 1 pc, we fitted a constant
HR2 function to the sources for 0.2 pc <​ r <​ 3.8 pc, taking into account the
­systematic and statistical errors. The fit gives a large χ2
value (χ = .ν
3 02
for 89 d.o.f.,
P =​ 1.1 ×​ 10−19
), which establishes the non-constancy of HR2 and thus the
­presence of a different source population for r <​ 1 pc. The outliers were excluded
in this analysis of HR2 spatial constancy because their HR2 values are more than
5σ from even the lowest HR2 (with error) from the 64 other 1 pc <​ r <​ 3.8 pc
sources. However, consistent with the KS test, one HR2 <​ 0.3 source at r <​ 1 could
be associated with the r >​ 1 pc source population(s). Because the χ2
test is
­parametric and depends on the assumption of spatial constancy of the dominant
IP population, it is weaker than the non-parametric KS test, which makes no
assumptions about the spatial dependence of HR2 and includes the outliers; but it
provides additional confirmation of the newly identified population for r <​ 1 pc.
The two outlier sources have sufficient counts to enable us to fit their Chandra
spectra. Fitting with an absorbed power-law model yields very soft photon indi-
ces (Γ >​ 4), indicating thermal X-ray spectra. The source CXO J174540.20−​
285900.8 fits well to an absorbed blackbody model with kT ≈​ 0.5 ±​ 0.1 keV. The
best-­fitting blackbody temperature is consistent with persistent thermal emission
of a ­magnetar with typical temperatures of kT ≈​ 0.3–0.5 keV (ref. 39). The other
source (CXO J174537.98−​290134.5) exhibits several emission lines in the energy
range E ≈​ 2–3 keV and its spectrum fits to an absorbed, optically thin thermal
plasma (tbabs*apec) model with best-fitting temperature kT =​ 0.8 ±​ 0.1 keV.
© 2017 Macmillan Publishers Limited, part of Springer Nature. All rights reserved.
Letter RESEARCH
This source is probably a dwarf nova, given that its temperature is lower than those
of IPs and polars. The two outliers are not shown in Fig. 3 and Extended Data Fig. 3.
Colour–colour analysis. One systematic uncertainty that must be addressed in
both the hardness ratio analysis and the spectral analysis is the possible ­degeneracy
between hydrogen column density and spectral hardness/softness. There are spatial
variations in the hydrogen column density in the Galactic Centre. These ­variations
can cause an intrinsically hard source at low NH in the Chandra bandpass to be
misidentified as a more highly absorbed soft source, because both may yield the
same HR2. We investigated whether this degeneracy could lead to systematically
lower HR2 values in the central parsec. The degeneracy would also affect the
spectral analysis, as discussed below. To evaluate the possibility of degeneracy
affecting our analysis, we resorted to colour–colour plots, a method that is com-
monly used to estimate the severity of absorption effects. For this investigation
the second colour HR3 was used, because it utilizes the 1–3-keV energy band and
so is more sensitive to hydrogen column density than is HR2, which focuses on
higher-energy X-rays. To assess the sensitivity of HR3 to absorption effects, the
XSPEC routine fakeit was used to generate simulated Chandra spectra of both
IP thermal spectra at kT =​ 8–40 keV and non-thermal power-law spectra with
Γ ≈​ 1–2.5. XSPEC simulations were used to calculate HR2 and HR3 for the input
spectra. They demonstrated that an intrinsic HR2 >​ 0.3 source could only appear
as an apparent HR2 <​ 0.3 source, owing to lower column density, if HR3 ≤​ 0.6.
On the contrary, HR2 <​ 0.3 sources always have HR3 ≥​ 0.9. Extended Data Fig. 5
shows a HR2–HR3 scatter plot of all of the sources, differentiating those for r <​ 1 pc
(cyan) and those for r >​ 1 pc (red). With the exception of two sources (which are
intrinsically hard sources with low NH ≈​ 1022
cm−2
, on the basis of spectral fitting),
all of the HR2 <​ 0.3 sources have high HR3, confirming that they are intrinsi-
cally soft spectral sources rather than hard sources (intrinsic HR2 >​ 0.3) with low
column density masquerading as low-HR2 soft sources. In fact, the systematics of
the absorption are such that very high column densities would cause intrinsically
low-HR2 sources to appear as higher-HR2 sources with high HR3. Thus the HR2
analysis of the number of soft sources for r <​ 1 pc is conservative.
Quantile hardness ratio analysis. More recently, extensive use has been made of
quantile analysis14,35
instead of the colour–colour analysis of Extended Data Fig. 5.
Quantile plots have been shown to be more effective in breaking photon index
(hardness ratio)–hydrogen column density degeneracies. Extended Data Fig. 6
shows the same data as in Extended Data Fig. 5, but in a quantile plot. Here Qn is
the energy within which n% of the photons in the 2–8-keV band are contained and
m is the median energy below which 50% of the photons in the band are contained.
The quantile diagram also shows contours of column density and photon index,
along which the quantile parameters of the x and y axis have been calculated using
an assumed non-thermal spectral shape and Chandra’s response function. The
diagram clearly shows the two distinct populations of sources. Nearly all of the
sources for r >​ 1 pc have Γ <​ 1 whereas about half of the sources for r <​ 1 pc have
softer power-law photon indices of Γ ≈​ 1–2. The large scatter of all of the sources
with column density shows no systematic bias in source hardness due to column
density effects.
Spectral analysis of individual, bright Chandra sources. A spectral ­analysis,
albeit available for only a smaller number of sources (13 for r <​ 1 pc and 28 for
1 pc <​ r <​ 3.8 pc) provides a second method for confirming the presence of
distinct source populations inside and outside 1 pc. We fitted Chandra spectra of
the sources with sufficient net counts (C ≥​ 200) using thermal (tbabs*pcfabs*apec)
and non-thermal models (tbabs*powerlaw) in XSPEC. Spectral bins were adap-
tively re-binned so that the counts in each bin have at least 3σ statistical significance
over background.
Outside r =​ 1 pc, 16 of the 28 HR2 >​ 0.3 sources with C ≥​ 200 are well fitted by
a thermal model with kT ≈​ 5–10 keV. These brighter sources, as demonstrated by
the example shown in Extended Data Fig. 1a, clearly exhibit broad iron lines at
6–7 keV, characteristic of mCVs. The fainter 10 HR2 >​ 0.3 sources are well fitted
by hard power-law models with Γ <​ 1. Previous studies15
with Chandra also found
that faint mCVs are readily fitted by power laws with Γ ≈​ 0–1.
In contrast, inside r =​ 1 pc, the five HR2 <​ 0.3 sources with C ≥​ 200 are well
fitted by a power-law model with Γ ≈​ 1.5–2 and no apparent iron lines. Extended
Data Fig. 1b shows the spectrum of a bright HR2 <​ 0.3 source with C =​ 267 fitted to
a power-law model with Γ =​ 1.9 ±​ 0.3. Of the seven HR2 >​ 0.3 sources, similarly to
the case of r >​ 1 pc sources, the five bright sources are well fitted by a thermal model
with broad iron lines and the two fainter sources by a power-law model with Γ <​ 1.
Using the logN–logS values measured for both of the soft sources, and a
much larger sample of hard sources (IPs) in the Galactic Centre (N(>​S) =​ kS−α
,
α =​ 1.4)35
, we expect around four soft and eight hard sources inside r =​ 1 pc to
have sufficient counts for spectral analysis. These numbers are roughly consistent
with the five soft and seven hard sources inside r =​ 1 pc that we found that are
amenable to spectral fitting.
MARX simulation. To validate our source/background extraction method and the
subsequent spectroscopy and colour photometry, we employed MARX simulations
followed by AE analysis. MARX simulation allows us to input sources, represent-
ing mCVs and BH-LMXBs, on top of the diffuse, gaseous structures in order to
assess whether we can recover the proper input spectrum and the input HR2 hard-
ness ratios within statistical uncertainties. We generated fake point sources with
input power-law spectra with Γ =​ 1.5–2. Input X-ray fluxes were adjusted to give
C =​ 100–200 in the 2–8-keV band, similar to those of the 12 HR2 <​ 0.3 sources
for r <​ 1 pc (Extended Data Table 1). In each MARX simulation, 5–10 fake sources
were added to all 45 Chandra observations at various source-free locations within
0.2 pc <​ r <​ 1 pc including the ridge detected by ref. 40 (representing one of the
highest background regions in r ​ =​0.2–3.8 pc). This is the most realistic simulation
because we take into account the actual background, vignetting, point spread func-
tion and dithering effects for all 45 Chandra observations used for data analysis. A
total of 124 hard and soft sources were run at 32 positions at r ​ <​ 1 pc. The MARX
sources were placed as close as possible to the observed sources whenever feasible.
Often a MARX simulation was run repeatedly at a given position to build up sta-
tistics on photometry and spectral recovery in the face of counting statistics. We
analysed the simulated Chandra data using AE, calculated hardness ratios of
the fake sources and performed spectral fitting with XSPEC. We recovered the
(soft) input HR2 values within statistical errors for 65 out of 67 simulated sources
with C  ​ 100. Thus, the probability of misidentifying an intrinsically soft source
(HR2 < 0.3) as a hard source (HR2 > 0.3) is about 3%. More importantly, the prob-
ability for hard sources (with IP thermal spectra) with C  ​ 100 being misidentified
as soft sources was about 2% (56 out of 57 simulated hard sources). Thus, at r ​ <​ 1 pc,
the mean number of soft sources turning into hard sources is about 0.4 and the
mean number of hard sources turning into soft sources is about 0.3. For fainter
sources with C ≤​ 50, the false probability increases to more than about 20%. Thus,
we conclude that the threshold for reliable, spectroscopic identification between
non-thermal X-ray sources and IPs is C ​ 100 throughout the 0.2 pc <​  r ​ <​3.8 pc
region we analysed.
Scattering effects on spectral analysis. Owing to dust scattering of X-ray
photons, a point source can appear with a diffuse halo that extends beyond a
­typical source-extraction region41
. Dust scattering haloes have been detected from
Chandra observations of bright X-ray transients (such as AX J1745.6−​290142
and
Swift J174540.7−​29001543
). Because the dust scattering is more substantial at low
energy, the X-ray spectrum of a source may appear harder if scattered photons
are not fully collected within an extraction region. For example, a non-thermal
power-law X-ray spectrum could be hardened by up to Δ​Γ ≤​ 0.5 when NH >​ 1023
cm−2
(ref. 44). Unlike bright X-ray transients, no dust scattering halo is observed
from the (fainter) Chandra X-ray sources because it is buried under diffuse X-ray
background in the Galactic Centre.
To assess the effects of dust scattering, we applied a spectral model42
. The model
parameters, such as grain sizes and types, column densities and distances of dust
layers, have been uniquely determined by fitting the Chandra radial profiles of the
outbursting NS-LMXB AX J1745.6−​2901, which lies 1.5 arcmin away from Sgr A*​.
The model requires a foreground dust layer in the spiral arms a few kiloparsecs
away from the Galactic Centre and another layer closer to AX J1745.6−​2901. The
foreground dust layer with NH ≈​ 1.7 ×​ 1023
cm−2
is likely to lie in the line of sight
for other X-ray sources within a few arcmin of Sgr A*​ (ref. 42).
We simulated Chandra ACIS-I spectra that correspond to our source-­extraction
size (typically 1″​) using various input spectral models, including a power-law
with Γ ≈​ 1–2.5 (representing non-thermal sources) and a partially covered APEC
model with kT ≈​ 20 keV (representing typical IP-like spectra). For each spectral
model, we simulated Chandra ACIS-I spectra with and without the multiplica-
tive ­fgcdust ­scattering model in XSPEC. Then, we calculated HR2 hardness ratios.
We also fit power-law (tbabs*powerlaw) and thermal (tbabs*pcfabs*apec) models
to the ­simulated spectra of non-thermal and thermal sources, respectively. The
differences in the best-fitting HR2 values, power-law indices and temperatures
between the simulated Chandra spectra with and without the dust scattering model
­provide an estimate for how much spectral hardening could be caused by typical
dust scattering in the Galactic Centre. Regardless of the input model, thermal or
non-thermal, dust scattering hardens HR2 by Δ​HR2 =​ 0.1. Thus, our hardness
selection using HR2 is relatively unaffected by dust scattering for the relevant
spectral types. The net effect of dust scattering is to harden non-thermal and
thermal Chandra spectra by Δ​Γ =​ 0.3 (consistent with previous results44
) and
Δ​kT =​ 0.5 keV, respectively.
Stacked spectra analysis. That the HR2 cut produces two distinct source
­populations is further supported by an analysis of stacked Chandra ACIS spectra
in the central parsec. Using the combine_spectra command in the Chandra analysis
software CIAO, we combined source and background spectra files for each group
of the HR2 <​ 0.3 and HR2 >​ 0.3 sources. We excluded several sources from the
© 2017 Macmillan Publishers Limited, part of Springer Nature. All rights reserved.
LetterRESEARCH
stacked spectra because their very high background counts are dominant and so
lower the signal-to-noise ratios. Figs 2a and b in the main text show the stacked
spectrum of the 8 HR2 >​ 0.3 sources with strong Fe lines and 12 HR2 <​ 0.3 sources,
respectively. In both cases, all sources have net counts C  ​ 100 and they are located
in the central parsec.
First, we fitted an absorbed power-law model (tbabs*powerlaw) to both stacked
Chandra spectra. To accurately determine the spectral parameters and column
density NH, we applied the multiplicative fgcdust dust scattering model41
. The
stacked Chandra spectra of the HR2 <​ 0.3 sources in the central parsec are well
fitted (χ = .ν
0 812
 , d.o.f. =​ 51) by an absorbed power-law model yieldingΓ = . − .
+ .
1 9 0 3
0 3
and = . ×− .
+ . −N 0 8 10 cmH 0 2
0 2 23 2 (Fig. 2b).
We found that the 14 HR2 > 0.3 sources at r ​ < 1 pc divide into two subgroups
with different spectral characteristics: 8 of them exhibit strong Fe lines in their
Chandra spectra, while the other 6 sources show either no or weak Fe lines. An
absorbed power-law model fit to both stacked spectra yields a hard photon index
of Γ ≈ 0.6–0.7. The hard photon index (Γ ​1) is a common signature of IPs45
. The
power-law model yields a poor fit to the stacked spectra of the
8 HR2 >​ 0.3 sources with strong Fe lines (χ = .ν
1 902
for 39 d.o.f.).
Since the IP spectra are physically best modelled as emission from an optically
thin thermal plasma, we employed the APEC model in XSPEC. We added a
partial-covering absorption model (pcfabs) to account for photo-absorption in the
accretion curtain or X-ray reflection from the white dwarf surface and a Gaussian
line component for the neutral Fe-K fluorescence line13
. Using this fiducial IP
spectral model, that is, fgcdust*tbabs*fcfabs*(apec+gauss), the stacked Chandra
spectra of the 8 HR2 > 0.3 sources with strong Fe lines fit well, yielding the best-fit
temperature of = . − .
+ .
kT 6 3 keV1 7
1 6
(Fig. 2a), while the stacked Chandra spectra of
the 6 HR2 > 0.3 sources with no Fe lines fit to a significantly higher temperature
(​kT = 19−10 keV). In the latter case, the temperature is not well constrained owing
to the lack of Fe lines in the Chandra energy band below 8 keV. It is likely that the
HR2 > 0.3 sources are composed of 8 IPs with ​kT ≈ 5–8 keV (with Fe lines) and 6
IPs with higher temperatures where the Fe complex is over-ionized.
The overall stacked spectrum of all 14 HR2 > 0.3 sources fits to a partially
coveredthermalmodelwell(χ = .ν
0 802
 ,d.o.f. = 58),yieldingthebest-fittemperature
of = . − .
+ .
kT 7 3 keV1 3
3 0
(Extended Data Fig. 7). The best-fit Fe abundance
= . − .
+ .
A 0 6Fe 0 2
0 3
(relative to solar) is consistent with previous spectral fits for the
unresolved, diffuse IP component of the CHXE6,13
. Our results from the best-fit
models are summarized in Extended Data Table 2. The best-fit plasma temperature
of = . − .
+ .
kT 7 3 keV1 3
3 0
represents an ensemble of IPs with different temperatures and
it is consistent with the stacked spectra of the HR2 > 0.3 sources for 1 pc <​ r <​ 3.8 pc
( = . − .
+ .
kT 5 5 keV)0 3
0 6
as well as the results from ref. 6 ( = . − .
+ .
kT 7 5 keV1 3
1 5
) and ref. 15
(kT ≈​ 7–9 keV).
Hard and soft spectrum background systematics. Here we address whether the
spectral difference between the soft and hard sources could be due to non-uniform
background in the Galactic Centre region or to thermal hotspots in the diffuse
emission. Extended Data Fig. 8 shows the stacked background spectra for both
the HR2 < 0.3 sources and HR2 > 0.3 sources (with C ≥ 100). They do not fit a
power-law model with large χ ≈ .ν
3 42
–3.6 owing to the emission lines at 2–4 keV
(from low-Z elements) and 6–7 keV (from Fe). Both background spectra fit
well with an absorbed two-temperature APEC model yielding χ ≈ .ν
1 22
–1.4.
The best-fit temperatures are consistent between the two background
spectra: = . − .
+ .
kT 0 93 keV1 0 04
0 10
and = . − .
+ .
kT 5 9 keV2 2 9
1 5
(for the soft source back-
ground) and = . − .
+ .
kT 1 18 keV1 0 04
0 05
and = . − .
+ .
kT 6 6 keV2 1 1
1 5
(for the hard source
background). Thus the spectrally distinct nature of the HR2 < 0.3 and HR2 > 0.3
sources cannot be attributed to spectral variations in the background, and their
backgrounds are not consistent with non-thermal spectra.
Spurious power-law spectra could result from subtracting thermal background
spectra from ‘hotspots’11
. These point-like hotspots are possibly due to small-scale
density variations (about 0.1 pc) in the (thermal) diffuse emission in the Galactic
Centre. They are speculated11
to be the origin of a thermal point source excess for
low-flux sources in the Galactic Centre. These should become significant only at
fluxes that corresponds to C ≤ 40, about 3–7 times below the net counts of the
HR2 < 0.3 sources. Nevertheless, we investigated the possibility that subtracting a
similar background spectrum from a hotspot thermal spectrum could produce a
power-law spectrum. Using the measured background for the HR2 < 0.3 sources,
XSPEC simulations were run for simulated thermal sources with plasma temper-
atures (kT2 = 3.5–8 keV) and abundance (Z2 = 0.3–1.5) encompassing those
observed in the central few parsecs. The source normalization was adjusted to
correspond to our observed source net counts. Using the same rebinning and fitting
procedures as for our overall analysis, we found that the stacked spectrum for the
12 simulated thermal hotspots was indeed a power law, but with best-fit photon
indices of Γ = 2.5–4, steeper than our observed HR2 < 0.3 sources (Γ = . − .
+ .
1 9 0 3
0 3
).
We could only get closer to our observations by adjusting the net counts to be well
below our 100-count threshold. And in almost all cases including the best-fit
photon indices Γ ≈2.5, the spectra showed strong emission lines at 2–4 keV and
6–7 keV (see typical example in Extended Data Fig. 9). Consequently, all the fits
were poor with an absorbed power-law model (χ ≈ .ν
1 42
–1.8 with approximately
50–60 d.o.f.) and, owing to the emission lines, looked nothing like our featureless
spectra of the HR2 < 0.3 sources.
Variability study. For the 12 HR2 < 0.3 point sources within r < 1 pc, we eval-
uated their X-ray variability by applying the Bayesian-Block (BB) algorithm46
to
the unbinned photon arrival times after removing time gaps between the Chandra
observations spanning around 12 years. No exposure map or vignetting effect
correction is required because we verified that none of the sources at r ​ < 1 pc are
near the chip gaps and all 45 observations were pointed at Sgr A*. The BB algorithm
is more sensitive to short-term variability than the KS test, which evaluates the sta-
tistical significance of variability over the full time interval. Our analysis followed
ref. 46. Among the 12 HR2 < 0.3 X-ray sources, 6 sources (50%) were variable at
the 90%–99% confidence level (Extended Data Table 1). Since the BB algorithm
works on source and background events, we did an independent timing analysis on
nearby regions to ensure that variability was not due to time varying background.
Although BH-LMXBs and rMSPs both exhibit non-thermal X-ray spectra, X-ray
variability can be used to distinguish between them. Most (around 70%) of the
known BH-LMXBs observed in the quiescent state on multiple occasions have
shown evidence of X-ray flux variability, many by a factor of 2–5 over a times-
cale of days to years, owing to accretion23
. On the other hand, rMSPs display no
such long-term variability. Whereas a majority of rMSPs emit thermal X-rays
with blackbody temperatures of kT <​ 0.3 keV originating from the polar caps,
non-thermal X-ray emission has been detected from about 30% of rMSPs24,47,48
.
The population of rMSPs with only soft thermal emission, if they are located in
the Galactic Centre, are not ­observable in the X-ray band because the soft thermal
X-ray emission of this population will be completely absorbed owing to high col-
umn density NH ≈​ 1023
cm−2
. The ­population with non-thermal emission, which
represents just over one-third of all approximately 50 known rMSPs detected in the
X-ray band, exhibit power-law spectra with Γ =​ 1–1.5 and LX ≈​ 1030
–1033
erg s−1
.
The non-thermal X-ray emission from rMSPs originates either from the magne-
tosphere or from an intra-binary shock (for rMSPs in binary systems)24,48
. Orbital
variability has sometimes been detected owing to eclipsing from the companion48
.
Isolated MSPs do not show X-ray variability on timescales greater than their mil-
lisecond spin periods because non-thermal X-rays are emitted from the magne-
tosphere24
. On the other hand, non-thermal X-ray emission from binary rMSPs
often exhibits modulation over the orbital periods of these sources (hours to a few
days); but these sources do not show the long-term variability that is observed
for many of the Chandra point sources in the Galactic Centre. Thus, the detec-
tion of long-term variability over months or years in the Chandra sources can be
used as a strong indicator against rMSPs. On the other hand, timing studies of
nearby qBH-LMXBs show that about 30% of them do not show variability and
one would expect an even larger fraction to appear ‘steady’ at the great distance of
the Galactic Centre, where variability is harder to detect and poorly constrained in
fields of high background. Based on this variability argument, one-half or less of the
HR2 < 0.3 sources may be rMSPs.
Population analysis. Flaring emission from the coronae of main-sequence stars
has been proposed previously to account for a substantial fraction of the soft-X-ray
emission in the Galactic Centre, but only in the central approximately 0.1 pc (ref. 22).
The mean luminosity of these stars in the quiescent state is more than three orders
of magnitude below our sensitivity limit and, even when flaring, a factor of about
30 below our sensitivity limit (1028
–1030
erg s−1
)22
. The active stellar binaries (RS
CVn, BY Dra and Algols) are similarly excluded because even objects in the bright
RS CVn class have a luminosity of about 1030
–1031
erg s−1
, more than about three
times below the detection threshold22
. Moreover, because the stellar mass inside
1 pc is 40% less than that in the 1 pc <​ r <​ 3.8 pc annulus and X-ray emitting
stars are not present in the annulus, the contribution of stars inside 1 pc must be
negligible.
Spatial morphology. We extracted the power-law index for the three-dimensional
density n(r) of soft (HR2 <​ 0.3) sources by using the assumed form n(r) =​ kr−γ
and
projecting this along the line of sight to obtain a best fit to the surface density
Σ(R) =​ kR−β
. The appropriate integral is ∫Σ ρ= − − /R r r r R r( ) 2 ( )( ) d2 2 1 2 , where
r and R are the actual and projected distances from Sgr A*​, respectively. We used
a Python fitting routine in the scipy.optimize.curve_ fit package. For the qBH-LMXB
candidates this gives γ = . − .
+ .
2 4 0 3
0 3
. If the steady rMSP candidate sources are
removed, a slightly shallower cusp results, with γ = . − .
+ .
2 0 0 7
0 7
. We also included
fainter sources with C ≥​ 50 to estimate the radial extent of the soft source distribu-
tion without the rMSP candidates. This yields a power-law index of γ = . − .
+ .
1 5 0 5
0 5
.
The stellar cusp was recently detected49
in the population of old stars in the Galactic
Centre and at a comparable projected distance range to that explored here, but had
an associated power-law fit with a comparable cusp of γ =​ 1.5.
© 2017 Macmillan Publishers Limited, part of Springer Nature. All rights reserved.
Letter RESEARCH
Total number of non-thermal sources in the central parsec. We used the logN–
logS plot in Extended Data Fig. 2 to estimate the total number of non-thermal
sources. The extrapolation to fainter sources below the Chandra flux threshold was
based on a previously reported intrinsic luminosity distribution50
. The slope of
this distribution (α = . − .
+ .
1 4 0 1
0 1
) is in agreement, within errors, with that measured
for the qBH-LMXB candidates in the central parsec (α = . − .
+ .
1 8 0 2
0 2
). A cross-check
on the logN–logS results can be obtained by using the measured slope for the soft,
r <​ 1 pc sources to calculate the mean luminosity per source, assuming that the
logN–logS plot extends down to the faintest qBH-LMXB observed50
locally. We
have ∫ ∫/ = /L N N L L L N L L(total) ( ) d ( )d , where N(L) =​ dN(>​L)/dL and the lim-
its of integration are set by the previously used value48
of Lmin and the intrinsic
luminosity of the brightest soft source that we observed in the central parsec. This
gives 〈​L〉​ =​ 4 ×​ 1031
erg s−1
for the soft sources of the central parsec, in good agree-
ment with the previously observed50
mean luminosity of 5 ×​ 1031
erg s−1
. However,
the estimate of the total non-thermal source population should be viewed with
caution. It is based on the value of Lmin of a small sample (18) of relatively nearby
black-hole binaries and it is unclear how representative these are of the qBH-
LMXBs of the Galactic Centre. As an example, increasing Lmin by a factor of two
would reduce the extrapolated number of sources by a factor of about three.
Although we cannot rule out that the steady sources that comprise one-half
of our non-thermal sources in the central parsec are rMSPs, we might expect
them to have a more extended spatial distribution, because neutron stars receive
substantial kick velocities on formation. Even when situated in binaries, and taking
into account the higher escape velocity in the Galactic Centre, a more extended
distribution, beyond 1 pc, for the rMSP population is likely. However, because
rMSPs are an old population, those that have escaped the centre may be located
at much larger distances than the 3.8 pc to which our analysis extends. Those in
the central parsec are the fraction that did not have sufficient kinetic energy to
escape. In fact, all of our observations are within the approximately 3-pc influ-
ence radius in the Galactic Centre. Detailed modelling is required to resolve these
questions.
Transient emission from the qBH-LMXB. Four X-ray binary transients were
previously reported in the central parsec, representing an over-density per unit
stellar mass of about 20 times compared to the surrounding tens of parsecs25
.
Subsequent work established that three of those transients are NS-LMXBs, ­leaving
one potential BH-LMXB candidate in the central parsec, which has had only its
original large outburst in more than a decade of monitoring17,18
. More recently,
­several new transients that are strong BH-LMXB candidates have been identified
in the Galactic Centre (K.M., C.J.H., D. Haggard, B.J.H., C. Jin, S. Mandel, M.
Nynka, G. Ponti and J. Tomsick, manuscript in preparation). If qBH-LMXBs have
large outburst recurrence times of about 100 years, then in more than 10 years of
­monitoring 40 or more outbursts would have been expected from the extrapolated
qBH-LMXB population, which is clearly inconsistent with observations. If the
recurrence time is about 1,000 years, then there is rough consistency between the
number of BH-LMXB transients observed in the central parsec over the more
than 10 years of monitoring, and the non-detection of large outbursts among
the dozen X-ray binaries reported here. Such a long recurrence time may not be
implausible. Observations of the local qBH-LMXB population reveal a correla-
tion between luminosity and orbital period, such that the sources below our flux
threshold all have orbital periods P of less than about 10 h. But according to the
accretion disk instability model, very faint systems with P less than about 10 h are
precisely those whose accretion rate is below the critical rate required to induce
large outbursts. If they are accreting at around 10−3
times the critical accretion rate,
then recurrence times of around 1,000 years are realized. The qBH-LMXBs above
our detection threshold are both brighter and, according to the LX–P correlation,
should have longer periods. They would therefore burst at a higher rate, but still
be ­consistent with the non-observation of large outbursts from their locations.
A similar ­argument, based on a low accretion rate leading to a lack of recurrent
outbursts, has been used to explain the inefficiency of X-ray searches in uncov-
ering black hole–Be binaries51
. No such problem arises for rMSPs, which do not
have outbursts.
Code availability. We used standard software for all our data analysis: the Chandra
Interactive Analysis of Observations (CIAO; http://cxc.harvard.edu/ciao/), the
MARX simulator (http://space.mit.edu/CXC/MARX/), the ACIS Extract package
(http://personal.psu.edu/psb6/TARA/AE.html) and NASA’s HEASOFT software
(https://heasarc.nasa.gov/lheasoft/).
Data availability. The Chandra data that support the findings of this study are
available from NASA’s HEASARC data archive (https://heasarc.gsfc.nasa.gov/docs/
archive.html). The data shown in the figures and tables are available from the
corresponding author on reasonable request.
31.	 Broos, P. S. et al. Innovations in the analysis of Chandra-ACIS observations.
Astrophys. J. 714, 1582–1605 (2010).
32.	 Arnaud, K. A. XSPEC: the first ten years. ASP Conf. Ser. 101, 17–20
(1996).
33.	 Wilms, J., Allen, A. & McCray, R. On the absorption of X-rays in the interstellar
medium. Astrophys. J. 542, 914–924 (2000).
34.	 Davis, J. E. et al. Raytracing with MARX: X-ray observatory design, calibration,
and support. Proc. SPIE 8443, 84431A (2012).
35.	 Hong, J. et al. NuSTAR hard X-ray survey of the galactic center region. II. X-ray
point Sources. Astrophys. J. 825, 132 (2016).
36.	 Sakano, M. et al. Unusual X-ray transients in the Galactic Centre. Mon. Not. R.
Astron. Soc. 357, 1211–1218 (2005).
37.	 Ponti, G. et al. A powerful flare from Sgr A*​confirms the synchrotron nature of
the X-ray emission. Mon. Not. R. Astron. Soc. 468, 2447–2468 (2017).
38.	 Takata, J., Cheng, K. S. & Taam, R. E. X-ray and gamma-ray emissions from
different evolutionary stage of rotation powered millisecond pulsars. Astrophys.
J. 745, 100 (2012).
39.	 Kaspi, V. M. & Beloborodov, A. M. Magnetars. Annu. Rev. Astron. Astrophys. 55,
261–301 (2017).
40.	 Rockefeller, G., Fryer, C. L., Baganoff, F. K. & Melia, F. The X-ray ridge surrounding
Sagittarius A* at the Galactic Center. Astrophys. J. 635, L141–L144 (2005).
41.	 Overbeck, J. W. Small-angle scattering of celestial X-rays by interstellar grains.
Astrophys. J. 141, 864–866 (1965).
42.	 Jin, C. et al. Probing the interstellar dust towards the Galactic Centre:
dust-scattering halo around AX J1745.6−​2901. Mon. Not. R. Astron. Soc. 468,
2532–2551 (2017).
43.	 Corrales, L. R. et al. The Chandra dust-scattering halo of Galactic Center
transient Swift J174540.7−​290015. Astrophys. J. 839, 76 (2017).
44.	 Corrales, L. et al. The dust-scattering component of X-ray extinction: effects on
continuum fitting and high-resolution absorption edge structure. Mon. Not. R.
Astron. Soc. 458, 1345–1351 (2016).
45.	 Bradley, C. K. The spectrum of the black hole X-ray nova V404 Cygni in
quiescence as measured by XMM-Newton. Astrophys. J. 667, 427–432
(2007).
46.	 Scargle, J. D., Norris, J. P., Jackson, B. & Chiang, J. Studies in astronomical time
series analysis. VI. Bayesian block representations. Astrophys. J. 764, 167
(2013).
47.	 Overbeck, J. W. Small-angle scattering of celestial X-rays by interstellar grains.
Astrophys. J. 141, 864–866 (1965).
48.	 Bogdanov, S. et al. Chandra X-ray observations of the 12 millisecond pulsars in
the globular cluster M28. Astrophys. J. 730, 81 (2011).
49.	 Schödel, R. et al. The distribution of stars around the Milky Way’s central black
hole. II. Diffuse light from sub-giants and dwarfs. Astron. Astrophys. https://doi.
org/10.1051/0004-6361/201730452 (2017).
50.	 Armas Padilla, M. et al. Swift J1357.2−​0933: the faintest black hole? Mon. Not.
R. Astron. Soc. 444, 902–905 (2014).
51.	 Casares, J. et al. A Be-type star with a black-hole companion. Nature 505,
378–381 (2014).
© 2017 Macmillan Publishers Limited, part of Springer Nature. All rights reserved.
LetterRESEARCH
Extended Data Figure 1 | Example Chandra spectra of thermal and
non-thermal X-ray sources. a, CXO J174541.02−​290017.6 (HR2 >​ 0.3).
b, CXO J174539.48−​290045.8 (HR2 <​ 0.3). The hard (thermal) source
spectrum, which exhibits a broad emission line at E =​ 6–7 keV, is fitted
by a partially covered APEC model, whereas the soft (non-thermal)
source spectrum is fitted by an absorbed power-law model. The error bars
represent 1σ statistical uncertainties. The bottom panels show residuals
(data minus model) in terms of 1σ significance.
© 2017 Macmillan Publishers Limited, part of Springer Nature. All rights reserved.
Letter RESEARCH
Extended Data Figure 2 | A cumulative X-ray flux distribution of the
qBH-LMXB candidates within 1 pc. A logN–logS histogram of the
12 HR2 <​ 0.3 sources (assuming all are qBH-LMXBs) is plotted, where S
denotes an absorbed 2–8-keV flux. The best-fitting power-law model is
shown as a solid blue line. An extrapolation of this line to the minimum
observed flux (1.9 ×​ 10−16
erg cm−2
s−1
, after correcting for higher X-ray
extinction in the Galactic Centre) of the local qBH-LMXB population50
is
used to estimate the total number of qBH-LMXBs in the central parsec.
© 2017 Macmillan Publishers Limited, part of Springer Nature. All rights reserved.
LetterRESEARCH
Extended Data Figure 3 | Hardness ratio for X-ray point sources with
C ≥ 100 as a function of the projected radial distance from Sgr A*.
The horizontal line denotes the best fit to a radially constant hardness ratio
(HR2 =​ 0.53), which yields a poor fit with χ = .ν
3 02
for 89 d.o.f. We took
into account statistical and systematic errors in the HR2 data; the error
bars in the figure indicate 1σ statistical uncertainties. The hypothesis
of spatial constancy of HR2 is thus rejected with P =​ 1.1 ×​ 10−19
. The
bifurcation in HR2 at r ​ 1 pc is clearly visible.
© 2017 Macmillan Publishers Limited, part of Springer Nature. All rights reserved.
Letter RESEARCH
0 0.5 1 1.5 2 2.5 3 3.5 4 4.5 5
90% 23
90%
90%
90%
27
26
24
90% 23
90%
90%
90%
27
26
24
Extended Data Figure 4 | Chandra images of the soft source CXO
J174540.79−290024.5 and its extracted background events.
a, Neighborhood image around the source (labelled 26, with multiple
green circles near the centre indicating source extraction regions for
different observations) along with other Chandra catalogue sources
indicated by numbers 23, 24 and 27. b, Background image around the
source (labelled 26 and located near the centre with a green circle)
from ObsID 11843. The red dashed circle indicates the inner circle of
the background annulus (r = 2.5″). Note that background was properly
extracted from an annulus of r ≈ 2.5″–4″ by excluding the nearby Chandra
sources indicated by green circles labelled 23, 24 and 27.
© 2017 Macmillan Publishers Limited, part of Springer Nature. All rights reserved.
LetterRESEARCH
Extended Data Figure 5 | Colour–colour diagram of X-ray sources
with C ≥ 100 within radial projected distances from Sgr A*. HR2
and HR3 hardness data are plotted for sources at r <​ 1 pc (cyan) and
1 pc < r <​ 3.8 pc (red). The error bars represent 1σ statistical uncertainties.
There is no clear evidence of HR3–HR2 correlation, a surrogate for
column-density- or scattering-related effects. The vertical dotted grey line
indicates our dividing line at HR2 =​ 0.3 between the soft and hard sources.
For reference, the calculated HR2 and HR3 for four local IPs, whose
spectra were extrapolated to the distance of Sgr A*, are shown as black
diamonds. They cluster at high HR2, as expected. Only three of the four IP
diamonds are visible because two of them overlap.
© 2017 Macmillan Publishers Limited, part of Springer Nature. All rights reserved.
Letter RESEARCH
Extended Data Figure 6 | Median photon energy in the spectrum versus
hardness ratio of X-ray sources with C ≥ 100. Sources for r <​  1 pc and
r >​ 1 pc are indicated in cyan and red, respectively. The median m =​ Q50
and the ratio of two quartiles Q25/Q75 are calculated for each source14
. The
energy scale across the top shows the median energy values (E50%). The blue
and red lines correspond to hydrogen column density NH and power-law
photon index Γ grids, respectively. The error bars represent 1σ statistical
uncertainties.
© 2017 Macmillan Publishers Limited, part of Springer Nature. All rights reserved.
LetterRESEARCH
Extended Data Figure 7 | Stacked Chandra ACIS-I spectrum of the
14 thermal X-ray sources with net counts C ≥ 100 within r < 1 pc.
The spectrum is well fitted with a partially covered thermal APEC model
with a Gaussian line at 6.4 keV (χ = .ν
0 802
for 58 d.o.f.). The error bars
represent 1σ statistical uncertainties. The bottom panels show residuals
(data minus model) in terms of 1σ significance. The best-fit parameters
are shown in Extended Data Table 2.
10−5
5×10⁻⁶
2×10⁻⁵
5×10⁻⁵
ctss−1keV−1
5
−2
0
2
σ
Energy (keV)
© 2017 Macmillan Publishers Limited, part of Springer Nature. All rights reserved.
Letter RESEARCH
Extended Data Figure 8 | Stacked background Chandra ACIS-I spectra
of the sources with net counts C ≥ 100 within r < 1 pc. a, 12 HR2 < 0.3
sources. b, 14 HR2 > 0.3 sources. Several prominent emission lines are
present from low-Z elements (below 4 keV) and Fe (at 6–7 keV). Both
background spectra are well fitted with an absorbed two-temperature
thermal APEC model: χ = .ν
1 212
(291 d.o.f.; soft source background) and
χ = .ν
1 262
(320 d.o.f.; hard source background). The best-fit temperatures
are consistent between the two background spectra: = . − .
+ .
kT 0 93 keV1 0 04
0 10
and = . − .
+ .
kT 5 9 keV2 2 9
1 5
(for the soft source background) and
= . − .
+ .
kT 1 18 keV1 0 04
0 05
and = . − .
+ .
kT 6 6 keV2 1 1
1 5
(for the hard source
background). The error bars represent 1σ statistical uncertainties.
The bottom panels show residuals (data minus model) in terms of
1σ significance.
a b
10−5
10−4
2×10⁻⁶
5×10⁻⁶
2×10⁻⁵
5×10⁻⁵
ctss−1
keV−1
2 5
−2
0
2
σ
Energy (keV)
10−5
10−4
2×10⁻⁶
5×10⁻⁶
2×10⁻⁵
5×10⁻⁵
ctss−1
keV−1
52
−2
0
2
σ
Energy (keV)
© 2017 Macmillan Publishers Limited, part of Springer Nature. All rights reserved.
LetterRESEARCH
Extended Data Figure 9 | Simulated Chandra ACIS-I spectrum using
a two-temperature thermal APEC model. The input parameters are
kT1 = 1.0 keV and Z1 = 2.5 (for the lower-temperature component) and
kT2 = 5.0 keV and Z2 = 0.6 (for the higher-temperature component).
The spectrum was poorly fit with an absorbed power-law model yielding
χ = .ν
1 652
(56 d.o.f.; hard source background) and showing large residuals
at 2–3 keV and 6–7 keV. The best-fit photon index (Γ = . − .
+ .
3 1 0 4
0 4
) is
significantly softer than that of the stacked soft source spectrum in
Fig. 2b (Γ = . − .
+ .
1 9 0 3
0 3
).
10−5
10−4
5×10⁻⁶
2×10⁻⁵
5×10⁻⁵
ctss−1keV−1
52
−4
−2
0
2
4
σ
Energy (keV)
© 2017 Macmillan Publishers Limited, part of Springer Nature. All rights reserved.
Letter RESEARCH
Extended Data Table 1 | The 12 non-thermal (soft) X-ray sources with C ≥ 100 in the central parsec
The last column indicates the source detection significance calculated by wavdetect, a wavelet algorithm used widely for Chandra analysis. The sources have HR2 <​ 0.3.
© 2017 Macmillan Publishers Limited, part of Springer Nature. All rights reserved.
LetterRESEARCH
Extended Data Table 2 | Best-fitting parameters from fitting the stacked Chandra spectra
The errors indicate 1σ statistical uncertainties. The spectral models are a partially covered APEC model with a Gaussian line and an absorbed power-law model for the 14 hard (HR2 >​ 0.3) and the
12 soft sources (HR2 <​ 0.3), respectively. The line energy and width of the Gaussian line component are fixed to 6.4 keV and 0.01 keV to account for the neutral Fe-K fluorescence line. The parameters of
the partial covering absorption component are poorly constrained owing to spectral fitting in the narrow 2–8-keV energy band.
© 2017 Macmillan Publishers Limited, part of Springer Nature. All rights reserved.

Mais conteúdo relacionado

Mais procurados

Exocometary gas in_th_hd_181327_debris_ring
Exocometary gas in_th_hd_181327_debris_ringExocometary gas in_th_hd_181327_debris_ring
Exocometary gas in_th_hd_181327_debris_ringSérgio Sacani
 
A candidate sub-parsec binary black hole in the Seyfert galaxy NGC 7674
A candidate sub-parsec binary black hole in the Seyfert galaxy NGC 7674A candidate sub-parsec binary black hole in the Seyfert galaxy NGC 7674
A candidate sub-parsec binary black hole in the Seyfert galaxy NGC 7674Sérgio Sacani
 
Identification of the central compact object in the young supernova remnant 1...
Identification of the central compact object in the young supernova remnant 1...Identification of the central compact object in the young supernova remnant 1...
Identification of the central compact object in the young supernova remnant 1...Sérgio Sacani
 
Too much pasta_for_pulsars_to_spin_down
Too much pasta_for_pulsars_to_spin_downToo much pasta_for_pulsars_to_spin_down
Too much pasta_for_pulsars_to_spin_downSérgio Sacani
 
The Internal Structure of Asteroid (25143) Itokawa as Revealed by Detection o...
The Internal Structure of Asteroid (25143) Itokawa as Revealed by Detection o...The Internal Structure of Asteroid (25143) Itokawa as Revealed by Detection o...
The Internal Structure of Asteroid (25143) Itokawa as Revealed by Detection o...WellingtonRodrigues2014
 
Serendipitous discovery of an extended xray jet without a radio counterpart i...
Serendipitous discovery of an extended xray jet without a radio counterpart i...Serendipitous discovery of an extended xray jet without a radio counterpart i...
Serendipitous discovery of an extended xray jet without a radio counterpart i...Sérgio Sacani
 
From the workshop "High-Resolution Submillimeter Spectroscopy of the Interste...
From the workshop "High-Resolution Submillimeter Spectroscopy of the Interste...From the workshop "High-Resolution Submillimeter Spectroscopy of the Interste...
From the workshop "High-Resolution Submillimeter Spectroscopy of the Interste...Lars E. Kristensen
 
Herschel far infrared_spectroscopy_of_the_galactic_center
Herschel far infrared_spectroscopy_of_the_galactic_centerHerschel far infrared_spectroscopy_of_the_galactic_center
Herschel far infrared_spectroscopy_of_the_galactic_centerSérgio Sacani
 
The canarias einstein_ring_a_newly_discovered_optical_einstein_ring
The canarias einstein_ring_a_newly_discovered_optical_einstein_ringThe canarias einstein_ring_a_newly_discovered_optical_einstein_ring
The canarias einstein_ring_a_newly_discovered_optical_einstein_ringSérgio Sacani
 
The open cluster_ngc6520_and_the_nearby_dark_molecular_cloud_barnard_86
The open cluster_ngc6520_and_the_nearby_dark_molecular_cloud_barnard_86The open cluster_ngc6520_and_the_nearby_dark_molecular_cloud_barnard_86
The open cluster_ngc6520_and_the_nearby_dark_molecular_cloud_barnard_86Sérgio Sacani
 
A magnetar-powered X-ray transient as the aftermath of a binary neutron-star ...
A magnetar-powered X-ray transient as the aftermath of a binary neutron-star ...A magnetar-powered X-ray transient as the aftermath of a binary neutron-star ...
A magnetar-powered X-ray transient as the aftermath of a binary neutron-star ...Sérgio Sacani
 
X rays - mission science
X rays - mission scienceX rays - mission science
X rays - mission scienceMahirakhxn
 
The shadow _of_the_flying_saucer_a_very_low_temperature_for_large_dust_grains
The shadow _of_the_flying_saucer_a_very_low_temperature_for_large_dust_grainsThe shadow _of_the_flying_saucer_a_very_low_temperature_for_large_dust_grains
The shadow _of_the_flying_saucer_a_very_low_temperature_for_large_dust_grainsSérgio Sacani
 
Magnetic interaction of_a_super_cme_with_the_earths_magnetosphere_scenario_fo...
Magnetic interaction of_a_super_cme_with_the_earths_magnetosphere_scenario_fo...Magnetic interaction of_a_super_cme_with_the_earths_magnetosphere_scenario_fo...
Magnetic interaction of_a_super_cme_with_the_earths_magnetosphere_scenario_fo...Sérgio Sacani
 
Detectcion of noble_gas_molecular_ion_arh_in_the_crab_nebula
Detectcion of noble_gas_molecular_ion_arh_in_the_crab_nebulaDetectcion of noble_gas_molecular_ion_arh_in_the_crab_nebula
Detectcion of noble_gas_molecular_ion_arh_in_the_crab_nebulaSérgio Sacani
 
Detection of the_central_star_of_the_planetary_nebula_ngc6302
Detection of the_central_star_of_the_planetary_nebula_ngc6302Detection of the_central_star_of_the_planetary_nebula_ngc6302
Detection of the_central_star_of_the_planetary_nebula_ngc6302Sérgio Sacani
 
50 Years of the Astronomy Centre at the University of Sussex
50 Years of the Astronomy Centre at the University of Sussex50 Years of the Astronomy Centre at the University of Sussex
50 Years of the Astronomy Centre at the University of SussexPeter Coles
 
First discovery of_a_magnetic_field_in_a_main_sequence_delta_scuti_star_the_k...
First discovery of_a_magnetic_field_in_a_main_sequence_delta_scuti_star_the_k...First discovery of_a_magnetic_field_in_a_main_sequence_delta_scuti_star_the_k...
First discovery of_a_magnetic_field_in_a_main_sequence_delta_scuti_star_the_k...Sérgio Sacani
 

Mais procurados (20)

Exocometary gas in_th_hd_181327_debris_ring
Exocometary gas in_th_hd_181327_debris_ringExocometary gas in_th_hd_181327_debris_ring
Exocometary gas in_th_hd_181327_debris_ring
 
A candidate sub-parsec binary black hole in the Seyfert galaxy NGC 7674
A candidate sub-parsec binary black hole in the Seyfert galaxy NGC 7674A candidate sub-parsec binary black hole in the Seyfert galaxy NGC 7674
A candidate sub-parsec binary black hole in the Seyfert galaxy NGC 7674
 
Identification of the central compact object in the young supernova remnant 1...
Identification of the central compact object in the young supernova remnant 1...Identification of the central compact object in the young supernova remnant 1...
Identification of the central compact object in the young supernova remnant 1...
 
Too much pasta_for_pulsars_to_spin_down
Too much pasta_for_pulsars_to_spin_downToo much pasta_for_pulsars_to_spin_down
Too much pasta_for_pulsars_to_spin_down
 
The Internal Structure of Asteroid (25143) Itokawa as Revealed by Detection o...
The Internal Structure of Asteroid (25143) Itokawa as Revealed by Detection o...The Internal Structure of Asteroid (25143) Itokawa as Revealed by Detection o...
The Internal Structure of Asteroid (25143) Itokawa as Revealed by Detection o...
 
Serendipitous discovery of an extended xray jet without a radio counterpart i...
Serendipitous discovery of an extended xray jet without a radio counterpart i...Serendipitous discovery of an extended xray jet without a radio counterpart i...
Serendipitous discovery of an extended xray jet without a radio counterpart i...
 
From the workshop "High-Resolution Submillimeter Spectroscopy of the Interste...
From the workshop "High-Resolution Submillimeter Spectroscopy of the Interste...From the workshop "High-Resolution Submillimeter Spectroscopy of the Interste...
From the workshop "High-Resolution Submillimeter Spectroscopy of the Interste...
 
Colloquium given at NASA/JPL
Colloquium given at NASA/JPLColloquium given at NASA/JPL
Colloquium given at NASA/JPL
 
Herschel far infrared_spectroscopy_of_the_galactic_center
Herschel far infrared_spectroscopy_of_the_galactic_centerHerschel far infrared_spectroscopy_of_the_galactic_center
Herschel far infrared_spectroscopy_of_the_galactic_center
 
The canarias einstein_ring_a_newly_discovered_optical_einstein_ring
The canarias einstein_ring_a_newly_discovered_optical_einstein_ringThe canarias einstein_ring_a_newly_discovered_optical_einstein_ring
The canarias einstein_ring_a_newly_discovered_optical_einstein_ring
 
Gas cloud black_hole
Gas cloud black_holeGas cloud black_hole
Gas cloud black_hole
 
The open cluster_ngc6520_and_the_nearby_dark_molecular_cloud_barnard_86
The open cluster_ngc6520_and_the_nearby_dark_molecular_cloud_barnard_86The open cluster_ngc6520_and_the_nearby_dark_molecular_cloud_barnard_86
The open cluster_ngc6520_and_the_nearby_dark_molecular_cloud_barnard_86
 
A magnetar-powered X-ray transient as the aftermath of a binary neutron-star ...
A magnetar-powered X-ray transient as the aftermath of a binary neutron-star ...A magnetar-powered X-ray transient as the aftermath of a binary neutron-star ...
A magnetar-powered X-ray transient as the aftermath of a binary neutron-star ...
 
X rays - mission science
X rays - mission scienceX rays - mission science
X rays - mission science
 
The shadow _of_the_flying_saucer_a_very_low_temperature_for_large_dust_grains
The shadow _of_the_flying_saucer_a_very_low_temperature_for_large_dust_grainsThe shadow _of_the_flying_saucer_a_very_low_temperature_for_large_dust_grains
The shadow _of_the_flying_saucer_a_very_low_temperature_for_large_dust_grains
 
Magnetic interaction of_a_super_cme_with_the_earths_magnetosphere_scenario_fo...
Magnetic interaction of_a_super_cme_with_the_earths_magnetosphere_scenario_fo...Magnetic interaction of_a_super_cme_with_the_earths_magnetosphere_scenario_fo...
Magnetic interaction of_a_super_cme_with_the_earths_magnetosphere_scenario_fo...
 
Detectcion of noble_gas_molecular_ion_arh_in_the_crab_nebula
Detectcion of noble_gas_molecular_ion_arh_in_the_crab_nebulaDetectcion of noble_gas_molecular_ion_arh_in_the_crab_nebula
Detectcion of noble_gas_molecular_ion_arh_in_the_crab_nebula
 
Detection of the_central_star_of_the_planetary_nebula_ngc6302
Detection of the_central_star_of_the_planetary_nebula_ngc6302Detection of the_central_star_of_the_planetary_nebula_ngc6302
Detection of the_central_star_of_the_planetary_nebula_ngc6302
 
50 Years of the Astronomy Centre at the University of Sussex
50 Years of the Astronomy Centre at the University of Sussex50 Years of the Astronomy Centre at the University of Sussex
50 Years of the Astronomy Centre at the University of Sussex
 
First discovery of_a_magnetic_field_in_a_main_sequence_delta_scuti_star_the_k...
First discovery of_a_magnetic_field_in_a_main_sequence_delta_scuti_star_the_k...First discovery of_a_magnetic_field_in_a_main_sequence_delta_scuti_star_the_k...
First discovery of_a_magnetic_field_in_a_main_sequence_delta_scuti_star_the_k...
 

Semelhante a A density cusp of quiescent X-ray binaries in the central parsec of the Galaxy

A 300 parsec-long jet-inflated bubble around a powerful microquasar in the ga...
A 300 parsec-long jet-inflated bubble around a powerful microquasar in the ga...A 300 parsec-long jet-inflated bubble around a powerful microquasar in the ga...
A 300 parsec-long jet-inflated bubble around a powerful microquasar in the ga...Sérgio Sacani
 
Millimetre-wave emission from an intermediatemass black hole candidate in the...
Millimetre-wave emission from an intermediatemass black hole candidate in the...Millimetre-wave emission from an intermediatemass black hole candidate in the...
Millimetre-wave emission from an intermediatemass black hole candidate in the...Sérgio Sacani
 
Large turbulent reservoirs of cold molecular gas around high-redshift starbur...
Large turbulent reservoirs of cold molecular gas around high-redshift starbur...Large turbulent reservoirs of cold molecular gas around high-redshift starbur...
Large turbulent reservoirs of cold molecular gas around high-redshift starbur...Sérgio Sacani
 
Bright radio emission_from_an_ultraluminous_stellar_mass_microquasar_in_m31
Bright radio emission_from_an_ultraluminous_stellar_mass_microquasar_in_m31Bright radio emission_from_an_ultraluminous_stellar_mass_microquasar_in_m31
Bright radio emission_from_an_ultraluminous_stellar_mass_microquasar_in_m31Sérgio Sacani
 
Dissecting x ray_emitting_gas_around_the_center_of_our_galaxy
Dissecting x ray_emitting_gas_around_the_center_of_our_galaxyDissecting x ray_emitting_gas_around_the_center_of_our_galaxy
Dissecting x ray_emitting_gas_around_the_center_of_our_galaxySérgio Sacani
 
An actively accreting massive black hole in the dwarf starburst galaxy henize...
An actively accreting massive black hole in the dwarf starburst galaxy henize...An actively accreting massive black hole in the dwarf starburst galaxy henize...
An actively accreting massive black hole in the dwarf starburst galaxy henize...Sérgio Sacani
 
The characterization of_the_gamma_ray_signal_from_the_central_milk_way_a_comp...
The characterization of_the_gamma_ray_signal_from_the_central_milk_way_a_comp...The characterization of_the_gamma_ray_signal_from_the_central_milk_way_a_comp...
The characterization of_the_gamma_ray_signal_from_the_central_milk_way_a_comp...Sérgio Sacani
 
Dense m agnetized_plasma_associated_with_afast_radio_burst
Dense m agnetized_plasma_associated_with_afast_radio_burstDense m agnetized_plasma_associated_with_afast_radio_burst
Dense m agnetized_plasma_associated_with_afast_radio_burstSérgio Sacani
 
Magnetic fields and relativistic electrons fill entire galaxy cluster
Magnetic fields and relativistic electrons fill entire galaxy clusterMagnetic fields and relativistic electrons fill entire galaxy cluster
Magnetic fields and relativistic electrons fill entire galaxy clusterSérgio Sacani
 
Detection of an_unindentified_emission_line_in_the_stacked_x_ray_spectrum_of_...
Detection of an_unindentified_emission_line_in_the_stacked_x_ray_spectrum_of_...Detection of an_unindentified_emission_line_in_the_stacked_x_ray_spectrum_of_...
Detection of an_unindentified_emission_line_in_the_stacked_x_ray_spectrum_of_...Sérgio Sacani
 
Giant magnetized outflows from the centre of the Milky Way
Giant magnetized outflows from the centre of the Milky WayGiant magnetized outflows from the centre of the Milky Way
Giant magnetized outflows from the centre of the Milky WayCarlos Bella
 
Giant magnetized outflows_from_the_centre_of_the_milk_way
Giant magnetized outflows_from_the_centre_of_the_milk_wayGiant magnetized outflows_from_the_centre_of_the_milk_way
Giant magnetized outflows_from_the_centre_of_the_milk_waySérgio Sacani
 
A 17 billion_solar_mass_black_hole_in_a_group_galaxy_with_a_difuse_core
A 17 billion_solar_mass_black_hole_in_a_group_galaxy_with_a_difuse_coreA 17 billion_solar_mass_black_hole_in_a_group_galaxy_with_a_difuse_core
A 17 billion_solar_mass_black_hole_in_a_group_galaxy_with_a_difuse_coreSérgio Sacani
 
Multi wavelenth observations and surveys of galaxy clusters
Multi wavelenth observations and surveys of galaxy clustersMulti wavelenth observations and surveys of galaxy clusters
Multi wavelenth observations and surveys of galaxy clustersJoana Santos
 
Nustar reveals extreme_absortion_in_z_05_type_2_quasars
Nustar reveals extreme_absortion_in_z_05_type_2_quasarsNustar reveals extreme_absortion_in_z_05_type_2_quasars
Nustar reveals extreme_absortion_in_z_05_type_2_quasarsSérgio Sacani
 
Radioastron observations of_the_quasar_3_c273_a_challenge_to_the_brightness_t...
Radioastron observations of_the_quasar_3_c273_a_challenge_to_the_brightness_t...Radioastron observations of_the_quasar_3_c273_a_challenge_to_the_brightness_t...
Radioastron observations of_the_quasar_3_c273_a_challenge_to_the_brightness_t...Sérgio Sacani
 
Radio continum emission_of_35_edge_on_galaxies_observed_with_the_vla
Radio continum emission_of_35_edge_on_galaxies_observed_with_the_vlaRadio continum emission_of_35_edge_on_galaxies_observed_with_the_vla
Radio continum emission_of_35_edge_on_galaxies_observed_with_the_vlaSérgio Sacani
 
Black hole growth in the early universe is self regulated and largely hidde...
 Black hole growth in the early universe is  self regulated and largely hidde... Black hole growth in the early universe is  self regulated and largely hidde...
Black hole growth in the early universe is self regulated and largely hidde...Sérgio Sacani
 
Superluminous spiral galaxies
Superluminous spiral galaxiesSuperluminous spiral galaxies
Superluminous spiral galaxiesSérgio Sacani
 

Semelhante a A density cusp of quiescent X-ray binaries in the central parsec of the Galaxy (20)

A 300 parsec-long jet-inflated bubble around a powerful microquasar in the ga...
A 300 parsec-long jet-inflated bubble around a powerful microquasar in the ga...A 300 parsec-long jet-inflated bubble around a powerful microquasar in the ga...
A 300 parsec-long jet-inflated bubble around a powerful microquasar in the ga...
 
Millimetre-wave emission from an intermediatemass black hole candidate in the...
Millimetre-wave emission from an intermediatemass black hole candidate in the...Millimetre-wave emission from an intermediatemass black hole candidate in the...
Millimetre-wave emission from an intermediatemass black hole candidate in the...
 
Large turbulent reservoirs of cold molecular gas around high-redshift starbur...
Large turbulent reservoirs of cold molecular gas around high-redshift starbur...Large turbulent reservoirs of cold molecular gas around high-redshift starbur...
Large turbulent reservoirs of cold molecular gas around high-redshift starbur...
 
Bright radio emission_from_an_ultraluminous_stellar_mass_microquasar_in_m31
Bright radio emission_from_an_ultraluminous_stellar_mass_microquasar_in_m31Bright radio emission_from_an_ultraluminous_stellar_mass_microquasar_in_m31
Bright radio emission_from_an_ultraluminous_stellar_mass_microquasar_in_m31
 
Dissecting x ray_emitting_gas_around_the_center_of_our_galaxy
Dissecting x ray_emitting_gas_around_the_center_of_our_galaxyDissecting x ray_emitting_gas_around_the_center_of_our_galaxy
Dissecting x ray_emitting_gas_around_the_center_of_our_galaxy
 
An actively accreting massive black hole in the dwarf starburst galaxy henize...
An actively accreting massive black hole in the dwarf starburst galaxy henize...An actively accreting massive black hole in the dwarf starburst galaxy henize...
An actively accreting massive black hole in the dwarf starburst galaxy henize...
 
The characterization of_the_gamma_ray_signal_from_the_central_milk_way_a_comp...
The characterization of_the_gamma_ray_signal_from_the_central_milk_way_a_comp...The characterization of_the_gamma_ray_signal_from_the_central_milk_way_a_comp...
The characterization of_the_gamma_ray_signal_from_the_central_milk_way_a_comp...
 
Final Poster
Final PosterFinal Poster
Final Poster
 
Dense m agnetized_plasma_associated_with_afast_radio_burst
Dense m agnetized_plasma_associated_with_afast_radio_burstDense m agnetized_plasma_associated_with_afast_radio_burst
Dense m agnetized_plasma_associated_with_afast_radio_burst
 
Magnetic fields and relativistic electrons fill entire galaxy cluster
Magnetic fields and relativistic electrons fill entire galaxy clusterMagnetic fields and relativistic electrons fill entire galaxy cluster
Magnetic fields and relativistic electrons fill entire galaxy cluster
 
Detection of an_unindentified_emission_line_in_the_stacked_x_ray_spectrum_of_...
Detection of an_unindentified_emission_line_in_the_stacked_x_ray_spectrum_of_...Detection of an_unindentified_emission_line_in_the_stacked_x_ray_spectrum_of_...
Detection of an_unindentified_emission_line_in_the_stacked_x_ray_spectrum_of_...
 
Giant magnetized outflows from the centre of the Milky Way
Giant magnetized outflows from the centre of the Milky WayGiant magnetized outflows from the centre of the Milky Way
Giant magnetized outflows from the centre of the Milky Way
 
Giant magnetized outflows_from_the_centre_of_the_milk_way
Giant magnetized outflows_from_the_centre_of_the_milk_wayGiant magnetized outflows_from_the_centre_of_the_milk_way
Giant magnetized outflows_from_the_centre_of_the_milk_way
 
A 17 billion_solar_mass_black_hole_in_a_group_galaxy_with_a_difuse_core
A 17 billion_solar_mass_black_hole_in_a_group_galaxy_with_a_difuse_coreA 17 billion_solar_mass_black_hole_in_a_group_galaxy_with_a_difuse_core
A 17 billion_solar_mass_black_hole_in_a_group_galaxy_with_a_difuse_core
 
Multi wavelenth observations and surveys of galaxy clusters
Multi wavelenth observations and surveys of galaxy clustersMulti wavelenth observations and surveys of galaxy clusters
Multi wavelenth observations and surveys of galaxy clusters
 
Nustar reveals extreme_absortion_in_z_05_type_2_quasars
Nustar reveals extreme_absortion_in_z_05_type_2_quasarsNustar reveals extreme_absortion_in_z_05_type_2_quasars
Nustar reveals extreme_absortion_in_z_05_type_2_quasars
 
Radioastron observations of_the_quasar_3_c273_a_challenge_to_the_brightness_t...
Radioastron observations of_the_quasar_3_c273_a_challenge_to_the_brightness_t...Radioastron observations of_the_quasar_3_c273_a_challenge_to_the_brightness_t...
Radioastron observations of_the_quasar_3_c273_a_challenge_to_the_brightness_t...
 
Radio continum emission_of_35_edge_on_galaxies_observed_with_the_vla
Radio continum emission_of_35_edge_on_galaxies_observed_with_the_vlaRadio continum emission_of_35_edge_on_galaxies_observed_with_the_vla
Radio continum emission_of_35_edge_on_galaxies_observed_with_the_vla
 
Black hole growth in the early universe is self regulated and largely hidde...
 Black hole growth in the early universe is  self regulated and largely hidde... Black hole growth in the early universe is  self regulated and largely hidde...
Black hole growth in the early universe is self regulated and largely hidde...
 
Superluminous spiral galaxies
Superluminous spiral galaxiesSuperluminous spiral galaxies
Superluminous spiral galaxies
 

Mais de Sérgio Sacani

Observational constraints on mergers creating magnetism in massive stars
Observational constraints on mergers creating magnetism in massive starsObservational constraints on mergers creating magnetism in massive stars
Observational constraints on mergers creating magnetism in massive starsSérgio Sacani
 
Observation of Gravitational Waves from the Coalescence of a 2.5–4.5 M⊙ Compa...
Observation of Gravitational Waves from the Coalescence of a 2.5–4.5 M⊙ Compa...Observation of Gravitational Waves from the Coalescence of a 2.5–4.5 M⊙ Compa...
Observation of Gravitational Waves from the Coalescence of a 2.5–4.5 M⊙ Compa...Sérgio Sacani
 
The SAMI Galaxy Sur v ey: galaxy spin is more strongly correlated with stella...
The SAMI Galaxy Sur v ey: galaxy spin is more strongly correlated with stella...The SAMI Galaxy Sur v ey: galaxy spin is more strongly correlated with stella...
The SAMI Galaxy Sur v ey: galaxy spin is more strongly correlated with stella...Sérgio Sacani
 
Is Betelgeuse Really Rotating? Synthetic ALMA Observations of Large-scale Con...
Is Betelgeuse Really Rotating? Synthetic ALMA Observations of Large-scale Con...Is Betelgeuse Really Rotating? Synthetic ALMA Observations of Large-scale Con...
Is Betelgeuse Really Rotating? Synthetic ALMA Observations of Large-scale Con...Sérgio Sacani
 
First Direct Imaging of a Kelvin–Helmholtz Instability by PSP/WISPR
First Direct Imaging of a Kelvin–Helmholtz Instability by PSP/WISPRFirst Direct Imaging of a Kelvin–Helmholtz Instability by PSP/WISPR
First Direct Imaging of a Kelvin–Helmholtz Instability by PSP/WISPRSérgio Sacani
 
The Sun’s differential rotation is controlled by high- latitude baroclinicall...
The Sun’s differential rotation is controlled by high- latitude baroclinicall...The Sun’s differential rotation is controlled by high- latitude baroclinicall...
The Sun’s differential rotation is controlled by high- latitude baroclinicall...Sérgio Sacani
 
Hydrogen Column Density Variability in a Sample of Local Compton-Thin AGN
Hydrogen Column Density Variability in a Sample of Local Compton-Thin AGNHydrogen Column Density Variability in a Sample of Local Compton-Thin AGN
Hydrogen Column Density Variability in a Sample of Local Compton-Thin AGNSérgio Sacani
 
Huygens - Exploring Titan A Mysterious World
Huygens - Exploring Titan A Mysterious WorldHuygens - Exploring Titan A Mysterious World
Huygens - Exploring Titan A Mysterious WorldSérgio Sacani
 
The Radcliffe Wave Of Milk Way is oscillating
The Radcliffe Wave Of Milk Way  is oscillatingThe Radcliffe Wave Of Milk Way  is oscillating
The Radcliffe Wave Of Milk Way is oscillatingSérgio Sacani
 
Thermonuclear explosions on neutron stars reveal the speed of their jets
Thermonuclear explosions on neutron stars reveal the speed of their jetsThermonuclear explosions on neutron stars reveal the speed of their jets
Thermonuclear explosions on neutron stars reveal the speed of their jetsSérgio Sacani
 
Identification of Superclusters and Their Properties in the Sloan Digital Sky...
Identification of Superclusters and Their Properties in the Sloan Digital Sky...Identification of Superclusters and Their Properties in the Sloan Digital Sky...
Identification of Superclusters and Their Properties in the Sloan Digital Sky...Sérgio Sacani
 
Digitized Continuous Magnetic Recordings for the August/September 1859 Storms...
Digitized Continuous Magnetic Recordings for the August/September 1859 Storms...Digitized Continuous Magnetic Recordings for the August/September 1859 Storms...
Digitized Continuous Magnetic Recordings for the August/September 1859 Storms...Sérgio Sacani
 
Shiva and Shakti: Presumed Proto-Galactic Fragments in the Inner Milky Way
Shiva and Shakti: Presumed Proto-Galactic Fragments in the Inner Milky WayShiva and Shakti: Presumed Proto-Galactic Fragments in the Inner Milky Way
Shiva and Shakti: Presumed Proto-Galactic Fragments in the Inner Milky WaySérgio Sacani
 
Legacy Analysis of Dark Matter Annihilation from the Milky Way Dwarf Spheroid...
Legacy Analysis of Dark Matter Annihilation from the Milky Way Dwarf Spheroid...Legacy Analysis of Dark Matter Annihilation from the Milky Way Dwarf Spheroid...
Legacy Analysis of Dark Matter Annihilation from the Milky Way Dwarf Spheroid...Sérgio Sacani
 
Introducing the Exoplanet Escape Factor and the Fishbowl Worlds (Two conceptu...
Introducing the Exoplanet Escape Factor and the Fishbowl Worlds (Two conceptu...Introducing the Exoplanet Escape Factor and the Fishbowl Worlds (Two conceptu...
Introducing the Exoplanet Escape Factor and the Fishbowl Worlds (Two conceptu...Sérgio Sacani
 
Revelando Marte - Livro Sobre a Exploração do Planeta Vermelho
Revelando Marte - Livro Sobre a Exploração do Planeta VermelhoRevelando Marte - Livro Sobre a Exploração do Planeta Vermelho
Revelando Marte - Livro Sobre a Exploração do Planeta VermelhoSérgio Sacani
 
Weak-lensing detection of intracluster filaments in the Coma cluster
Weak-lensing detection of intracluster filaments in the Coma clusterWeak-lensing detection of intracluster filaments in the Coma cluster
Weak-lensing detection of intracluster filaments in the Coma clusterSérgio Sacani
 
Quasar and Microquasar Series - Microquasars in our Galaxy
Quasar and Microquasar Series - Microquasars in our GalaxyQuasar and Microquasar Series - Microquasars in our Galaxy
Quasar and Microquasar Series - Microquasars in our GalaxySérgio Sacani
 
A galactic microquasar mimicking winged radio galaxies
A galactic microquasar mimicking winged radio galaxiesA galactic microquasar mimicking winged radio galaxies
A galactic microquasar mimicking winged radio galaxiesSérgio Sacani
 
The Search Of Nine Planet, Pluto (Artigo Histórico)
The Search Of Nine Planet, Pluto (Artigo Histórico)The Search Of Nine Planet, Pluto (Artigo Histórico)
The Search Of Nine Planet, Pluto (Artigo Histórico)Sérgio Sacani
 

Mais de Sérgio Sacani (20)

Observational constraints on mergers creating magnetism in massive stars
Observational constraints on mergers creating magnetism in massive starsObservational constraints on mergers creating magnetism in massive stars
Observational constraints on mergers creating magnetism in massive stars
 
Observation of Gravitational Waves from the Coalescence of a 2.5–4.5 M⊙ Compa...
Observation of Gravitational Waves from the Coalescence of a 2.5–4.5 M⊙ Compa...Observation of Gravitational Waves from the Coalescence of a 2.5–4.5 M⊙ Compa...
Observation of Gravitational Waves from the Coalescence of a 2.5–4.5 M⊙ Compa...
 
The SAMI Galaxy Sur v ey: galaxy spin is more strongly correlated with stella...
The SAMI Galaxy Sur v ey: galaxy spin is more strongly correlated with stella...The SAMI Galaxy Sur v ey: galaxy spin is more strongly correlated with stella...
The SAMI Galaxy Sur v ey: galaxy spin is more strongly correlated with stella...
 
Is Betelgeuse Really Rotating? Synthetic ALMA Observations of Large-scale Con...
Is Betelgeuse Really Rotating? Synthetic ALMA Observations of Large-scale Con...Is Betelgeuse Really Rotating? Synthetic ALMA Observations of Large-scale Con...
Is Betelgeuse Really Rotating? Synthetic ALMA Observations of Large-scale Con...
 
First Direct Imaging of a Kelvin–Helmholtz Instability by PSP/WISPR
First Direct Imaging of a Kelvin–Helmholtz Instability by PSP/WISPRFirst Direct Imaging of a Kelvin–Helmholtz Instability by PSP/WISPR
First Direct Imaging of a Kelvin–Helmholtz Instability by PSP/WISPR
 
The Sun’s differential rotation is controlled by high- latitude baroclinicall...
The Sun’s differential rotation is controlled by high- latitude baroclinicall...The Sun’s differential rotation is controlled by high- latitude baroclinicall...
The Sun’s differential rotation is controlled by high- latitude baroclinicall...
 
Hydrogen Column Density Variability in a Sample of Local Compton-Thin AGN
Hydrogen Column Density Variability in a Sample of Local Compton-Thin AGNHydrogen Column Density Variability in a Sample of Local Compton-Thin AGN
Hydrogen Column Density Variability in a Sample of Local Compton-Thin AGN
 
Huygens - Exploring Titan A Mysterious World
Huygens - Exploring Titan A Mysterious WorldHuygens - Exploring Titan A Mysterious World
Huygens - Exploring Titan A Mysterious World
 
The Radcliffe Wave Of Milk Way is oscillating
The Radcliffe Wave Of Milk Way  is oscillatingThe Radcliffe Wave Of Milk Way  is oscillating
The Radcliffe Wave Of Milk Way is oscillating
 
Thermonuclear explosions on neutron stars reveal the speed of their jets
Thermonuclear explosions on neutron stars reveal the speed of their jetsThermonuclear explosions on neutron stars reveal the speed of their jets
Thermonuclear explosions on neutron stars reveal the speed of their jets
 
Identification of Superclusters and Their Properties in the Sloan Digital Sky...
Identification of Superclusters and Their Properties in the Sloan Digital Sky...Identification of Superclusters and Their Properties in the Sloan Digital Sky...
Identification of Superclusters and Their Properties in the Sloan Digital Sky...
 
Digitized Continuous Magnetic Recordings for the August/September 1859 Storms...
Digitized Continuous Magnetic Recordings for the August/September 1859 Storms...Digitized Continuous Magnetic Recordings for the August/September 1859 Storms...
Digitized Continuous Magnetic Recordings for the August/September 1859 Storms...
 
Shiva and Shakti: Presumed Proto-Galactic Fragments in the Inner Milky Way
Shiva and Shakti: Presumed Proto-Galactic Fragments in the Inner Milky WayShiva and Shakti: Presumed Proto-Galactic Fragments in the Inner Milky Way
Shiva and Shakti: Presumed Proto-Galactic Fragments in the Inner Milky Way
 
Legacy Analysis of Dark Matter Annihilation from the Milky Way Dwarf Spheroid...
Legacy Analysis of Dark Matter Annihilation from the Milky Way Dwarf Spheroid...Legacy Analysis of Dark Matter Annihilation from the Milky Way Dwarf Spheroid...
Legacy Analysis of Dark Matter Annihilation from the Milky Way Dwarf Spheroid...
 
Introducing the Exoplanet Escape Factor and the Fishbowl Worlds (Two conceptu...
Introducing the Exoplanet Escape Factor and the Fishbowl Worlds (Two conceptu...Introducing the Exoplanet Escape Factor and the Fishbowl Worlds (Two conceptu...
Introducing the Exoplanet Escape Factor and the Fishbowl Worlds (Two conceptu...
 
Revelando Marte - Livro Sobre a Exploração do Planeta Vermelho
Revelando Marte - Livro Sobre a Exploração do Planeta VermelhoRevelando Marte - Livro Sobre a Exploração do Planeta Vermelho
Revelando Marte - Livro Sobre a Exploração do Planeta Vermelho
 
Weak-lensing detection of intracluster filaments in the Coma cluster
Weak-lensing detection of intracluster filaments in the Coma clusterWeak-lensing detection of intracluster filaments in the Coma cluster
Weak-lensing detection of intracluster filaments in the Coma cluster
 
Quasar and Microquasar Series - Microquasars in our Galaxy
Quasar and Microquasar Series - Microquasars in our GalaxyQuasar and Microquasar Series - Microquasars in our Galaxy
Quasar and Microquasar Series - Microquasars in our Galaxy
 
A galactic microquasar mimicking winged radio galaxies
A galactic microquasar mimicking winged radio galaxiesA galactic microquasar mimicking winged radio galaxies
A galactic microquasar mimicking winged radio galaxies
 
The Search Of Nine Planet, Pluto (Artigo Histórico)
The Search Of Nine Planet, Pluto (Artigo Histórico)The Search Of Nine Planet, Pluto (Artigo Histórico)
The Search Of Nine Planet, Pluto (Artigo Histórico)
 

Último

Best Call Girls In Sector 29 Gurgaon❤️8860477959 EscorTs Service In 24/7 Delh...
Best Call Girls In Sector 29 Gurgaon❤️8860477959 EscorTs Service In 24/7 Delh...Best Call Girls In Sector 29 Gurgaon❤️8860477959 EscorTs Service In 24/7 Delh...
Best Call Girls In Sector 29 Gurgaon❤️8860477959 EscorTs Service In 24/7 Delh...lizamodels9
 
CHROMATOGRAPHY PALLAVI RAWAT.pptx
CHROMATOGRAPHY  PALLAVI RAWAT.pptxCHROMATOGRAPHY  PALLAVI RAWAT.pptx
CHROMATOGRAPHY PALLAVI RAWAT.pptxpallavirawat456
 
Topic 9- General Principles of International Law.pptx
Topic 9- General Principles of International Law.pptxTopic 9- General Principles of International Law.pptx
Topic 9- General Principles of International Law.pptxJorenAcuavera1
 
Pests of soyabean_Binomics_IdentificationDr.UPR.pdf
Pests of soyabean_Binomics_IdentificationDr.UPR.pdfPests of soyabean_Binomics_IdentificationDr.UPR.pdf
Pests of soyabean_Binomics_IdentificationDr.UPR.pdfPirithiRaju
 
Pests of jatropha_Bionomics_identification_Dr.UPR.pdf
Pests of jatropha_Bionomics_identification_Dr.UPR.pdfPests of jatropha_Bionomics_identification_Dr.UPR.pdf
Pests of jatropha_Bionomics_identification_Dr.UPR.pdfPirithiRaju
 
Fertilization: Sperm and the egg—collectively called the gametes—fuse togethe...
Fertilization: Sperm and the egg—collectively called the gametes—fuse togethe...Fertilization: Sperm and the egg—collectively called the gametes—fuse togethe...
Fertilization: Sperm and the egg—collectively called the gametes—fuse togethe...D. B. S. College Kanpur
 
Base editing, prime editing, Cas13 & RNA editing and organelle base editing
Base editing, prime editing, Cas13 & RNA editing and organelle base editingBase editing, prime editing, Cas13 & RNA editing and organelle base editing
Base editing, prime editing, Cas13 & RNA editing and organelle base editingNetHelix
 
Vision and reflection on Mining Software Repositories research in 2024
Vision and reflection on Mining Software Repositories research in 2024Vision and reflection on Mining Software Repositories research in 2024
Vision and reflection on Mining Software Repositories research in 2024AyushiRastogi48
 
Pests of Bengal gram_Identification_Dr.UPR.pdf
Pests of Bengal gram_Identification_Dr.UPR.pdfPests of Bengal gram_Identification_Dr.UPR.pdf
Pests of Bengal gram_Identification_Dr.UPR.pdfPirithiRaju
 
trihybrid cross , test cross chi squares
trihybrid cross , test cross chi squarestrihybrid cross , test cross chi squares
trihybrid cross , test cross chi squaresusmanzain586
 
Dubai Calls Girl Lisa O525547819 Lexi Call Girls In Dubai
Dubai Calls Girl Lisa O525547819 Lexi Call Girls In DubaiDubai Calls Girl Lisa O525547819 Lexi Call Girls In Dubai
Dubai Calls Girl Lisa O525547819 Lexi Call Girls In Dubaikojalkojal131
 
Pests of Blackgram, greengram, cowpea_Dr.UPR.pdf
Pests of Blackgram, greengram, cowpea_Dr.UPR.pdfPests of Blackgram, greengram, cowpea_Dr.UPR.pdf
Pests of Blackgram, greengram, cowpea_Dr.UPR.pdfPirithiRaju
 
GenBio2 - Lesson 1 - Introduction to Genetics.pptx
GenBio2 - Lesson 1 - Introduction to Genetics.pptxGenBio2 - Lesson 1 - Introduction to Genetics.pptx
GenBio2 - Lesson 1 - Introduction to Genetics.pptxBerniceCayabyab1
 
Davis plaque method.pptx recombinant DNA technology
Davis plaque method.pptx recombinant DNA technologyDavis plaque method.pptx recombinant DNA technology
Davis plaque method.pptx recombinant DNA technologycaarthichand2003
 
User Guide: Capricorn FLX™ Weather Station
User Guide: Capricorn FLX™ Weather StationUser Guide: Capricorn FLX™ Weather Station
User Guide: Capricorn FLX™ Weather StationColumbia Weather Systems
 
Call Girls in Majnu Ka Tilla Delhi 🔝9711014705🔝 Genuine
Call Girls in Majnu Ka Tilla Delhi 🔝9711014705🔝 GenuineCall Girls in Majnu Ka Tilla Delhi 🔝9711014705🔝 Genuine
Call Girls in Majnu Ka Tilla Delhi 🔝9711014705🔝 Genuinethapagita
 
Speech, hearing, noise, intelligibility.pptx
Speech, hearing, noise, intelligibility.pptxSpeech, hearing, noise, intelligibility.pptx
Speech, hearing, noise, intelligibility.pptxpriyankatabhane
 
ALL ABOUT MIXTURES IN GRADE 7 CLASS PPTX
ALL ABOUT MIXTURES IN GRADE 7 CLASS PPTXALL ABOUT MIXTURES IN GRADE 7 CLASS PPTX
ALL ABOUT MIXTURES IN GRADE 7 CLASS PPTXDole Philippines School
 
Environmental Biotechnology Topic:- Microbial Biosensor
Environmental Biotechnology Topic:- Microbial BiosensorEnvironmental Biotechnology Topic:- Microbial Biosensor
Environmental Biotechnology Topic:- Microbial Biosensorsonawaneprad
 
Radiation physics in Dental Radiology...
Radiation physics in Dental Radiology...Radiation physics in Dental Radiology...
Radiation physics in Dental Radiology...navyadasi1992
 

Último (20)

Best Call Girls In Sector 29 Gurgaon❤️8860477959 EscorTs Service In 24/7 Delh...
Best Call Girls In Sector 29 Gurgaon❤️8860477959 EscorTs Service In 24/7 Delh...Best Call Girls In Sector 29 Gurgaon❤️8860477959 EscorTs Service In 24/7 Delh...
Best Call Girls In Sector 29 Gurgaon❤️8860477959 EscorTs Service In 24/7 Delh...
 
CHROMATOGRAPHY PALLAVI RAWAT.pptx
CHROMATOGRAPHY  PALLAVI RAWAT.pptxCHROMATOGRAPHY  PALLAVI RAWAT.pptx
CHROMATOGRAPHY PALLAVI RAWAT.pptx
 
Topic 9- General Principles of International Law.pptx
Topic 9- General Principles of International Law.pptxTopic 9- General Principles of International Law.pptx
Topic 9- General Principles of International Law.pptx
 
Pests of soyabean_Binomics_IdentificationDr.UPR.pdf
Pests of soyabean_Binomics_IdentificationDr.UPR.pdfPests of soyabean_Binomics_IdentificationDr.UPR.pdf
Pests of soyabean_Binomics_IdentificationDr.UPR.pdf
 
Pests of jatropha_Bionomics_identification_Dr.UPR.pdf
Pests of jatropha_Bionomics_identification_Dr.UPR.pdfPests of jatropha_Bionomics_identification_Dr.UPR.pdf
Pests of jatropha_Bionomics_identification_Dr.UPR.pdf
 
Fertilization: Sperm and the egg—collectively called the gametes—fuse togethe...
Fertilization: Sperm and the egg—collectively called the gametes—fuse togethe...Fertilization: Sperm and the egg—collectively called the gametes—fuse togethe...
Fertilization: Sperm and the egg—collectively called the gametes—fuse togethe...
 
Base editing, prime editing, Cas13 & RNA editing and organelle base editing
Base editing, prime editing, Cas13 & RNA editing and organelle base editingBase editing, prime editing, Cas13 & RNA editing and organelle base editing
Base editing, prime editing, Cas13 & RNA editing and organelle base editing
 
Vision and reflection on Mining Software Repositories research in 2024
Vision and reflection on Mining Software Repositories research in 2024Vision and reflection on Mining Software Repositories research in 2024
Vision and reflection on Mining Software Repositories research in 2024
 
Pests of Bengal gram_Identification_Dr.UPR.pdf
Pests of Bengal gram_Identification_Dr.UPR.pdfPests of Bengal gram_Identification_Dr.UPR.pdf
Pests of Bengal gram_Identification_Dr.UPR.pdf
 
trihybrid cross , test cross chi squares
trihybrid cross , test cross chi squarestrihybrid cross , test cross chi squares
trihybrid cross , test cross chi squares
 
Dubai Calls Girl Lisa O525547819 Lexi Call Girls In Dubai
Dubai Calls Girl Lisa O525547819 Lexi Call Girls In DubaiDubai Calls Girl Lisa O525547819 Lexi Call Girls In Dubai
Dubai Calls Girl Lisa O525547819 Lexi Call Girls In Dubai
 
Pests of Blackgram, greengram, cowpea_Dr.UPR.pdf
Pests of Blackgram, greengram, cowpea_Dr.UPR.pdfPests of Blackgram, greengram, cowpea_Dr.UPR.pdf
Pests of Blackgram, greengram, cowpea_Dr.UPR.pdf
 
GenBio2 - Lesson 1 - Introduction to Genetics.pptx
GenBio2 - Lesson 1 - Introduction to Genetics.pptxGenBio2 - Lesson 1 - Introduction to Genetics.pptx
GenBio2 - Lesson 1 - Introduction to Genetics.pptx
 
Davis plaque method.pptx recombinant DNA technology
Davis plaque method.pptx recombinant DNA technologyDavis plaque method.pptx recombinant DNA technology
Davis plaque method.pptx recombinant DNA technology
 
User Guide: Capricorn FLX™ Weather Station
User Guide: Capricorn FLX™ Weather StationUser Guide: Capricorn FLX™ Weather Station
User Guide: Capricorn FLX™ Weather Station
 
Call Girls in Majnu Ka Tilla Delhi 🔝9711014705🔝 Genuine
Call Girls in Majnu Ka Tilla Delhi 🔝9711014705🔝 GenuineCall Girls in Majnu Ka Tilla Delhi 🔝9711014705🔝 Genuine
Call Girls in Majnu Ka Tilla Delhi 🔝9711014705🔝 Genuine
 
Speech, hearing, noise, intelligibility.pptx
Speech, hearing, noise, intelligibility.pptxSpeech, hearing, noise, intelligibility.pptx
Speech, hearing, noise, intelligibility.pptx
 
ALL ABOUT MIXTURES IN GRADE 7 CLASS PPTX
ALL ABOUT MIXTURES IN GRADE 7 CLASS PPTXALL ABOUT MIXTURES IN GRADE 7 CLASS PPTX
ALL ABOUT MIXTURES IN GRADE 7 CLASS PPTX
 
Environmental Biotechnology Topic:- Microbial Biosensor
Environmental Biotechnology Topic:- Microbial BiosensorEnvironmental Biotechnology Topic:- Microbial Biosensor
Environmental Biotechnology Topic:- Microbial Biosensor
 
Radiation physics in Dental Radiology...
Radiation physics in Dental Radiology...Radiation physics in Dental Radiology...
Radiation physics in Dental Radiology...
 

A density cusp of quiescent X-ray binaries in the central parsec of the Galaxy

  • 1. 7 0 | N A T U R E | V O L 5 5 6 | 5 a p r i l 2 0 1 8 Letter doi:10.1038/nature25029 A density cusp of quiescent X-ray binaries in the central parsec of the Galaxy Charles J. Hailey1 , Kaya Mori1 , Franz E. Bauer2,3,4 , Michael E. Berkowitz1 , Jaesub Hong5 & Benjamin J. Hord1 The existence of a ‘density cusp’1,2 —a localized increase in number—of stellar-mass black holes near a supermassive black hole is a fundamental prediction of galactic stellar dynamics3 . The best place to detect such a cusp is in the Galactic Centre, where the nearest supermassive black hole, Sagittarius A*, resides. As many as 20,000 black holes are predicted to settle into the central parsec of the Galaxy as a result of dynamical friction3–5 ; however, so far no density cusp of black holes has been detected. Low-mass X-ray binary systems that contain a stellar-mass black hole are natural tracers of isolated black holes. Here we report observations of a dozen quiescent X-ray binaries in a density cusp within one parsec of Sagittarius A*. The lower-energy emission spectra that we observed in these binaries is distinct from the higher-energy spectra associated with the population of accreting white dwarfs that dominates the central eight parsecs of the Galaxy6 . The properties of these X-ray binaries, in particular their spatial distribution and luminosity function, suggest the existence of hundreds of binary systems in the central parsec of the Galaxy and many more isolated black holes. We cannot rule out a contribution to the observed emission from a population (of up to about one-half the number of X-ray binaries) of rotationally powered, millisecond pulsars. The spatial distribution of the binary systems is a relic of their formation history, either in the stellar disk around Sagittarius A* (ref. 7) or through in-fall from globular clusters, and constrains the number density of sources in the modelling of gravitational waves from massive stellar remnants8,9 , such as neutron stars and black holes. The Chandra X-ray Observatory has accumulated 1.4 ×​ 106  s of observations of the Galactic Centre using the Advanced CCD Imaging Spectrometer I (ACIS-I) over the past 12 years. Owing to the high concentration of X-ray sources in the Galactic Centre (such as Sagittarius A*​(hereafter Sgr A*​) and IRS 13) and the emission from hot gas, we restrict our analysis to angular distances of more than 5″​from Sgr A*​, which correspond to projected distances r of more than 0.2 pc assuming an 8-kpc distance to the Galactic Centre10 . From these Chandra observations, 415 X-ray point sources at projected distances of 0.2 pc <​ r <​ 3.8 pc from Sgr A*​were identified in the 2–8-keV energy band, and used for all analysis. Point sources were ignored if they were in diffuse regions such as filamentary structures or molecular clouds, were too close to very bright point sources or were previously known to have large X-ray outbursts. A net count (source minus background counts) limit of C ≥​ 100 (equivalent to a flux of 2 ×​ 10−15  erg cm−2  s−1 ) was used for the analysis. This count limit corresponds to a point source detection significance of 4σ. There are 92 sources with C ≥​ 100, 26 of which lie at r <​ 1 pc. For spectral fitting, a limit of C ≥​ 200 was used in order to constrain spectral parameters effectively: 13 sources with r <​ 1 pc met this criterion. This is too few sources for population analysis, so we instead use a hardness ratio of X-ray colour, or slope, HR2 =​ (CH −​ CL)/(CH +​ CL), where CL and CH are, respectively, the net counts from the source in the 2–4-keV (low) and 4–8-keV (high) energy bands. Previous Chandra analysis11 and simulations reported here demonstrate that the thermal emission of magnetic cataclysmic variable stars—which have typical temperatures of kT ≈​ 8–40 keV—in the Chandra energy band of 0.5–8 keV is well modelled by a single- temperature, optically thin thermal plasma and an iron line ­complex at an energy of E =​ 6–7 keV. By contrast, black-hole and ­neutron-star binaries and pulsars are universally characterized by non-­thermal power-law emission with a flux described by F(E) =​ kE−Γ   photons cm−2  s−1  keV−1 , where E is the photon energy in keV and Γ ≈​ 1.5–2 (ref. 12) is the photon index. The low- and high-energy bands for HR2 were chosen to maximally separate thermal and non-thermal sources. Thermal sources have HR2 values of more than 0.3, whereas non-thermal sources have HR2 values of less than 0.3. In Fig. 1a, b we show the HR2 distributions for sources with C ≥​ 100 that lie in the circle r <​ 1 pc and in the annulus 1 pc <​ r <​ 3.8 pc, respec- tively, centred on Sgr A*​. A second source population clearly appears at r <​ 1 pc in the range −​0.1 <​ HR2 <​ 0.3. Integrating the HR2 distri- bution in the annular region for HR2 <​ 0.3, we would expect at most one source with HR2 <​ 0.3 for r <​ 1 pc if the sources in the inner region are drawn from the same HR2 distribution as that for the sources in the annulus; however, there are 12 such sources. The diffuse, hard X-ray emission in the Galactic Centre, which ­dominates the inner 8 pc of the Galaxy6 , is due to unresolved magnetic cataclysmic variable stars (in particular, a sub-class known as interme- diate polars) with optically thin thermal emission of kT ≈​ 8–40 keV (ref. 13). These intermediate polars are the origin of the HR2 >​ 0.3 population. The newly identified HR2 <​ 0.3 population is prominent only inside the central parsec. Before concluding that the HR2 probability distribution in the inner parsec is due to a newly identified source population, we studied the confounding effects of the high concentration of gas and dust in the Galactic Centre. The high dust column density could preferentially scatter soft X-rays or lead to the well-known degeneracy between the spectral hardness and interstellar absorption of a source14 . Both of these effects could alter the HR2 distribution near Sgr A*​. They can be probed using a second, lower-energy-band hardness ratio to produce colour–colour plots, so-called quantile diagrams, and spectral simulations of thermal and non-thermal sources. All of these analyses demonstrate that the HR2 <​ 0.3 sources cannot be HR2 >​ 0.3 sources masquerading as apparent HR2 <​ 0.3 sources as a result of scattering or column-density effects (see Methods). The stacked spectra of the HR2 <​ 0.3 and HR2 >​ 0.3 sources in the inner parsec are compared in Fig. 2. The comparison provides further confirmation of the spectrally distinct nature of the HR2 <​ 0.3 sources in the inner parsec. The HR2 >​ 0.3 sources are well fitted by a thermal spectrum with partially covered absorption to account for an accretion curtain and scattering from the surface of a white dwarf—a model that is commonly applied to intermediate polars. The best-fitting ­temperature ( = . − . + . kT 6 3 keV1 7 1 6 , where the errors here and elsewhere 1 Columbia Astrophysics Laboratory, Columbia University, 550 West 120th Street, Room 1027, New York, New York 10027, USA. 2 Instituto de Astrofísica, Facultad de Física, Pontificia Universidad Católica de Chile, 306, Santiago 22, Chile. 3 Millennium Institute of Astrophysics, Vicuña Mackenna, 4860, 7820436 Macul, Santiago, Chile. 4 Space Science Institute, 4750 Walnut Street, Suite 205, Boulder, Colorado 80301, USA. 5 Harvard-Smithsonian Center for Astrophysics, 60 Garden Street, MS-83, Cambridge, Massachusetts 02138, USA. © 2017 Macmillan Publishers Limited, part of Springer Nature. All rights reserved.
  • 2. Letter RESEARCH 5 a p r i l 2 0 1 8 | V O L 5 5 6 | N A T U R E | 7 1 correspond to one standard deviation) is consistent not only with the temperatures of the HR2 >​ 0.3 sources at 1 pc <​ r <​ 3.8 pc, but also more generally with the low-temperature component of the (unre- solved) hard X-ray emission and the typical Chandra-measured ­temperature found for magnetic cataclysmic variable stars in the Galactic Centre15 . By contrast, the stacked spectrum of the HR2 <​ 0.3 sources in the inner parsec is well fitted (with a reduced chi-squared of χ = .ν 0 812 for 51 degrees of freedom (d.o.f.)) by a non-thermal ­power-law withΓ = . − . + . 1 9 0 3 0 3  , with no sign of neutral or ionized iron lines in the spectrum. A final confirmation of the newly identified, spectrally distinct source population in the inner approximately 1 pc comes from the 13 sources in the central parsec that are bright enough (C ≥​ 200) to enable spectral fitting. The HR2 <​ 0.3 sources are well fitted with a non-thermal spectrum and the HR2 >​ 0.3 sources with an intermediate- polar thermal model (see Methods for discussion and Extended Data Fig. 1 for examples). The spatially distinct morphology of this newly identified source population is shown in Fig. 3, with the HR2 <​ 0.3 sources concentrated in the central parsec and the HR2 >​ 0.3 sources extended over the region of the diffuse, hard X-ray emission. The newly identified popu­ lation is not extragalactic because the number of background active galactic nuclei (about 0.1)16 is negligible within the inner approximately 1 pc above the 2–8-keV flux threshold. The non-thermal spectrum, with Γ ≈​ 1.5–2 and lacking iron lines, clearly distinguishes this popu- lation from the population of thermally emitting intermediate polars that dominate at larger radii. We rule out neutron-star, low-mass X-ray binaries as candidates for the newly identified population because of the short recurrence time of about 5–10 years between their large X-ray outbursts. The continuous monitoring of the Galactic Centre for more than a decade is believed to have revealed all such binaries17,18 , and none of the point sources discussed here has ever produced an ­outburst. High-mass X-ray binaries comprise about 40% of all Galactic X-ray binaries12 and, given the large concentration of O and B stars in the cen- tral parsec19 , are potential contributors to the newly identified source population. However, infrared surveys that cover all of the Chandra X-ray sources in the Galactic Centre are able to rule out massive stellar companions20,21 , from bright O or B supergiants down to the faintest of the Be high-mass X-ray binaries (spectral class B2V), effectively elimi­ nating the possibility of a contribution of high-mass X-ray binaries. Coronally active isolated stars and stellar binaries having soft thermal spectra (corresponding to HR2 <​ −​0.3) are not observed among our sources in the central approximately 1 pc; in addition, their expected luminosities are well below the Chandra detection threshold. During an outburst they may have harder X-ray spectra, but would still be below the Chandra detection threshold, and their numbers are substantial only in the inner approximately 0.1 pc (ref. 22). The most plausible explanation for the non-thermal sources in the inner parsec is that they are quiescent black-hole low-mass X-ray ­binaries (qBH-LMXBs). Although qBH-LMXBs can exhibit ­modest variability23 , there is limited information about their long-term var- iability, so steady emission from qBH-LMXBs cannot be ruled out. Timing analysis of the non-thermal sources in the inner parsec over the 12 years of observations shows that 6 out of 12 of them are ­variable, whereas the remaining 6 are steady. Rotation-powered −1.0 −0.5 0 0.5 1.0 HR2 0 1 2 3 4 5 6 7 8 Frequency r < 1 pc r > 1 pc a b −1.0 −0.5 0 0.5 1.0 HR2 0 5 10 15 20 25 30 Figure 1 | Hardness ratio (HR2) distribution of X-ray point sources with net counts of C ≥ 100 at a projected radial distance from Sgr A*. a, Sources for r <​ 1 pc. b, Sources for 1 pc <​ r <​ 3.8 pc. A substantial population of sources with −​0.1 <​ HR2 <​ 0.3 appears for r <​ 1 pc (a). Of the 66 sources in the annulus (b), 2 (3%) have HR2 <​ 0.3, whereas of the 26 sources in the inner circle (a), 12 (46%) have HR2 <​ 0.3. A Kolmogorov– Smirnov test shows that the HR2 cumulative distribution function of the annular region is not consistent with that of the circular region (D =​ 0.528; P =​ 3.0 ×​ 10−5 ). The two outliers in b, at HR2 =​ −​0.56 and HR2 =​ −​0.74, were included in the Kolmogorov–Smirnov test. They account for at most one HR2 <​ 0.3 source in a, with a probability of about 2%. A χ2 test based on the lack of spatial constancy in HR2 between 1 pc <​ r <​ 3.8 pc and r <​ 1 pc also indicates a different source population for r <​ 1 pc (P =​ 1.1 ×​ 10−19 ). The Kolmogorov–Smirnov test, outliers and the χ2 test (Extended Data Fig. 3) are further discussed in Methods. a b Count(s–1keV–1) 10−5 5 × 10⁻⁶ 2 × 10⁻⁵ 5 × 10⁻⁵ 5 −2 0 2 Energy (keV) 10−5 5 × 10⁻⁶ 2 × 10⁻⁵ 5 × 10⁻⁵ 5 −2 0 2 Energy (keV) HR2 > 0.3 HR2 < 0.3 Figure 2 | Stacked Chandra spectra for X-ray sources within the inner parsec. a, Sources with HR2 >​ 0.3. b, Sources with HR2 <​ 0.3. The HR2 >​ 0.3 spectrum (a) for the 8 sources with strong Fe lines is well fitted by an optically thin, thermal plasma model with temperature = . − . + . kT 6 3 keV1 7 1 6 (χ = .ν 1 252 for 36 d.o.f.). A power-law model yields a poor fit (χ = .ν 1 902 for 39 d.o.f.; Γ = . − . + . 0 7 0 5 0 5 ). The 6 sources with weak or no Fe lines have a comparable best-fit photon index of Γ = . − . + . 0 6 0 4 0 4 ). These photon indices are typical of intermediate-polar spectra fitted with a power-law model in the Chandra energy bandpass11,13 . The HR2 <​ 0.3 spectrum (b) is well fitted by a power-law model with a significantly softer photon index (Γ = . − . + . 1 9 0 3 0 3 for 51 d.o.f.). Stacked spectra of the 14 HR2 >​ 0.3 sources (Extended Data Fig. 7) were fitted to a thermal plasma model with the best-fit temperature = . − . + . kT 7 3 keV1 3 3 0 (χ = .ν 0 802 for 58 d.o.f.), the typical Chandra-measured temperature (about 7–9 keV) for magnetic cataclysmic variables in the Galactic Centre6 . The error bars represent 1σ statistical uncertainties. The bottom panels show residuals (data minus model) in terms of 1σ significance. For more details on the stacked spectra analysis, see Methods. © 2017 Macmillan Publishers Limited, part of Springer Nature. All rights reserved.
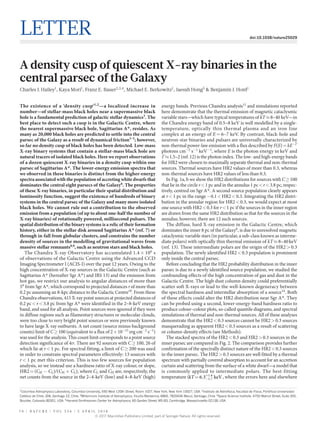
  • 3. LetterRESEARCH 7 2 | N A T U R E | V O L 5 5 6 | 5 a p r i l 2 0 1 8 ­millisecond pulsars (rMSPs) also have non-thermal emission consistent with HR2 <​ 0.3. However, rMSPs are always steady over timescales of months to years24 , so we cannot rule out that up to one-half of the non-thermal sources that we observe in the inner parsec are rMSPs. In Fig. 4 we show the surface density of the 12 non-thermal sources as a function of projected radius from Sgr A*​, from which we extract a three-dimensional cusp power-law index. The cusp index does not change in a statistically significant fashion if the six qBH-LMXB can- didates are analysed separately from the six rMSP candidates (see Methods for discussion). Owing to the complexities of the formation and evolution of BH-LMXBs, the agreement with the isolated black- hole prediction is probably coincidental. However, the concentration of black holes in the inner approximately 1 pc (well inside the influence radius at r ≈ 3 pc) that we observe has been predicted previously3 . In Extended Data Fig. 2 we show the logN–logS (number versus X-ray flux) for the qBH-LMXB candidate sources with r <​ 1 pc and down to the Chandra flux limit. A power-law fit to the logN–logS distribution (N(>​S) =​ kS−α , α= . − . + . 1 8 0 2 0 2 ) can then be extrapolated to the minimum flux of the local, known BH-LMXB population (see Methods) to give 600–1,000 qBH-LMXBs (1σ error on the fit) if all of the observed HR2 <​ 0.3 sources are qBH-LMXBs, and 300–500 if one-half of them are rMSPs. The lack of large outbursts from individual sources over more than a decade suggests outburst recurrence times of about 1,000 years, for which there is some theoretical motivation (see Methods). If the density cusp extends to Sgr A*​, then the qBH-LMXB counts must be corrected for the un­­observed volume inside 0.2 pc. For the best- fitting α and three-­dimensional cusp index γ, this correction would increase the total number of qBH-LMXBs for r <​ 1 pc by about 50%. To estimate an upper limit for the total number of rMSPs we use a previous result6 , obtained by using the measured correlation between the spin-down power E and the X-ray luminosity LX for a large sample of rMSPs, that the fraction of rMSPs above the Chandra flux threshold at the Galactic Centre is about 3%. We therefore set an upper limit of approximately 200 for the number of rMSPs in the Galactic Centre. Our estimated number of BH-LMXBs is a lower limit for the ­number of isolated black holes in the Galactic Centre. The total number of low- mass X-ray binaries is consistent with a previous estimate25 based on three-body exchange formation in in-falling globular clusters; however, it has been argued26 that this previous estimate is an overestimate by 10–100. If that is the case, then it is most likely that the black-hole binaries were formed via the tidal capture of old, low-mass stars (either orbiting Sgr A*​or formed in the surrounding stellar disk), and the observed number of BH-LMXBs necessitates the existence of more than about 10,000 isolated black holes (A. Generozov, B. Metzger, N. Stone and J. Ostriker, manuscript in preparation). Online Content Methods, along with any additional Extended Data display items and Source Data, are available in the online version of the paper; references unique to these sections appear only in the online paper. received 15 September 2016; accepted 6 November 2017. 1. Bahcall, J. N. & Wolf, R. A. Star distribution around a black hole in a globular cluster. Astrophys. J. 209, 214–232 (1976). 2. Bahcall, J. N. & Wolf, R. A. Star distribution around a black hole in a globular cluster. II. Unequal star masses. Astrophys. J. 216, 883–907 (1977). 3. Miralda-Escude, J. & Gould, A. A cluster of black holes at the Galactic Center. Astrophys. J. 545, 847–853 (2000). 4. Morris, M. Massive star formation near the Galactic Center and the fate of the stellar remnants. Astrophys. J. 408, 496–506 (1993). 5. Freitag, M. & Amaro-Seoane, P. Stellar remnants in galactic nuclei: mass segregation. Astrophys. J. 649, 91–117 (2006). 6. Perez, K. et al. Extended hard X-ray emission in the inner few parsecs of the Galaxy. Nature 520, 646–649 (2015). 7. Levin, Y. & Beloborodov, A. M. Stellar disk in the galactic center — a remnant of a dense accretion disk? Astrophys. J. 590, L33–L36 (2003). 8. Antonini, F. & Rasio, F. A. Merging black hole binaries in galactic nuclei: implications for Advanced-LIGO detections. Astrophys. J. 831, 187 (2016). 1 5 17 37 65 101 145 196 257 324 400 Figure 3 | Chandra 2–8-keV image of the Galactic Centre with X-ray sources with C ≥ 100 overlaid. Thermal (HR2 >​ 0.3) and non-thermal (HR2 <​ 0.3) sources are indicated with red and cyan circles, respectively. The colour scale indicates the number of 2–8-keV counts per pixel. The inner and outer yellow circles delineate the 0.2 pc <​ r <​ 1 pc region around Sgr A*​. The inner region was excluded from the analysis. The magenta ellipse (7.8 pc ×​ 3.9 pc, full-width at half-maximum) bounds the region of spatially unresolved hard X-ray emission that was discovered by NuSTAR and is due to thermal emission from intermediate polars. The non-thermal sources cluster inside the inner parsec, whereas the thermal sources are distributed more uniformly throughout the hard X-ray emission. The Galactic plane runs along the semi-major axis of the ellipse. The dearth of sources to the north of the Galactic plane is due to strong extinction from molecular clouds (such as the circumnuclear disk), which densely populate that region27 . This may reduce the estimated number of sources by a factor of a few. Some bright sources without circles are X-ray transients, including the outbursting neutron-star low-mass X-ray binary AX J1745−​2901 in the lower right corner. For reference, Chandra’s angular resolution is 0.5 arcsec, which corresponds to about 0.025 pc at the Galactic Centre. Projected radius from Sgr A* (pc) Surfacedensity(pc–2) 1 10 1 Figure 4 | Surface density of the 12 non-thermal sources as a function of projected radius from Sgr A*. Sources with C ≥​ 100 and C ≥​ 50 are indicated in black and red, respectively. The cusp power-law index γ of the non-thermal sources (HR2 <​ 0.3) was obtained by using an assumed three- dimensional form for the source density of n(r) =​ kr−γ and projecting this along the line-of-sight radius R to obtain a best fit to the surface density Σ(R) =​ kR−β . The best fit yields γ = . − . + . 2 4 0 3 0 3 . The isolated black-hole cusp around Sgr A*​is predicted to have a power-law index γ in the approximate range 1.3–2.3 (refs 26, 28–30). The red histogram is for sources with C ≥​ 50 and gives a crude estimate of the surface density at larger radii, although it may suffer from mild contamination from spurious background sources. The best-fitting power-law index in this case is γ = . − . + . 2 0 0 2 0 2 . There is no statistically significant difference in the power-law index if the six rMSP candidates are removed from the analysis. See Methods for more details of the cusp analysis. © 2017 Macmillan Publishers Limited, part of Springer Nature. All rights reserved.
  • 4. Letter RESEARCH 5 a p r i l 2 0 1 8 | V O L 5 5 6 | N A T U R E | 7 3 9. O’Leary, R. M., Kocsis, B. & Loeb, A. Gravitational waves from scattering of stellar-mass black holes in galactic nuclei. Mon. Not. R. Astron. Soc. 395, 2127–2146 (2009). 10. Reid, M. J. The distance to the center of the Galaxy. Annu. Rev. Astron. Astrophys. 31, 345–372 (1993). 11. Muno, M. P. et al. A catalog of X-ray point sources from two megaseconds of Chandra observations of the Galactic Center. Astrophys. J. Suppl. Ser. 181, 110–128 (2009). 12. Remillard, R. A. & McClintock, J. E. X-ray properties of black-hole binaries. Annu. Rev. Astron. Astrophys. 44, 49–92 (2006). 13. Hailey, C. J. et al. Evidence for intermediate polars as the origin of the Galactic Center hard X-ray emission. Astrophys. J. 826, 160 (2016). 14. Hong, J., Schlegel, E. M. & Grindlay, J. E. New spectral classification technique for X-ray sources: quantile analysis. Astrophys. J. 614, 508–517 (2004). 15. Muno, M. P. et al. The spectra and variability of X-ray sources in a deep Chandra observation of the Galactic Center. Astrophys. J. 613, 1179–1201 (2004). 16. Kim, M. et al. Chandra multiwavelength project X-ray point source number counts and cosmic X-Ray background. Astrophys. J. 659, 29–51 (2007). 17. Degenaar, N. et al. The Swift X-ray monitoring campaign of the center of the Milky Way. J. High Energy Astrophys. 7, 137–147 (2015). 18. Degenaar, N. et al. A four-year XMM-Newton/Chandra monitoring campaign in the Galactic Centre: analysing the X-ray transients. Astron. Astrophys. 545, A49 (2012). 19. Bartko, H. et al. An extremely top-heavy IMF in the Galactic Center stellar disks. Astrophys. J. 708, 834–840 (2010). 20. Mauerhan, J. C. et al. Near-infrared counterparts to Chandra X-ray sources toward the Galactic Center. I. Statistics and a catalog of candidates. Astrophys. J. 703, 30–41 (2009). 21. Laycock, S. et al. Constraining the nature of the Galactic Center X-ray source population. Astrophys. J. 634, L53–L56 (2005). 22. Sazonov, S., Sunyaev, R. & Revnivtsev, M. Coronal radiation of a cusp of spun-up stars and the X-ray luminosity of Sgr A*​. Mon. Not. R. Astron. Soc. 420, 388–404 (2012). 23. Plotkin, R. M. et al. The X-ray spectral evolution of galactic black hole X-ray binaries toward quiescence. Astrophys. J. 773, 59 (2013). 24. Bogdanov, S. et al. Chandra X-Ray observations of 19 millisecond pulsars in the globular cluster 47 Tucanae. Astrophys. J. 646, 1104–1115 (2006). 25. Muno, M. P. et al. An overabundance of transient X-ray binaries within 1 parsec of the Galactic Center. Astrophys. J. 622, L113–L116 (2005). Acknowledgements This work was partially supported by NASA contract no. NNG08FD60C. We thank P. Broos of the Chandra ACIS Instrument Team at Penn State for help with the ACIS Extract Package, and D. P. Huenemoerder and H. M. Guenther at MIT for help with the MARX simulation tool. We acknowledge C. Jin and G. Ponti for providing the dust scattering model. We thank A. Generozov, D. Helfand, L. Hui, S. Mandel, B. Metzger, J. Ostriker and N. Stone of Columbia University and Q. D. Wang at the University of Massachusetts at Amherst for discussions. F.E.B. acknowledges support from CONICYT-Chile (Basal-CATA PFB-06/2007, FONDECYT Regular 1141218), the Ministry of Economy, Development, and Tourism’s Millennium Science Initiative through grant IC120009, awarded to The Millennium Institute of Astrophysics, MAS. Author Contributions C.J.H., statistical and population analysis, interpretation and manuscript preparation; K.M., image and spectral analysis, interpretation and manuscript preparation; F.E.B., source extraction, MARX simulations and review; M.E.B., image, spectral and statistical analysis, MARX simulations and review; J.H., source extraction, MARX simulations and review; and B.J.H., image, spectral and population analysis, XSPEC simulations and review. Author Information Reprints and permissions information is available at www.nature.com/reprints. The authors declare no competing financial interests. Readers are welcome to comment on the online version of the paper. Publisher’s note: Springer Nature remains neutral with regard to jurisdictional claims in published maps and institutional affiliations. Correspondence and requests for materials should be addressed to C.J.H. (chuckh@astro.columbia.edu). Reviewer Information Nature thanks F. Baganoff, J. Miralda-Escudé and M. Morris for their contribution to the peer review of this work. 26. Hopman, C. Binary dynamics near a massive black hole. Astrophys. J. 700, 1933–1951 (2009). 27. Christopher, M. H. et al. HCN and HCO+ observations of the Galactic circumnuclear disk. Astrophys. J. 622, 346–365 (2005). 28. Alexander, T. & Hopman, C. The effect of mass segregation on gravitational sources near massive black holes. Astrophys. J. 645, L133–L136 (2006). 29. Alexander, T. & Hopman, C. Strong mass segregation around a massive black hole. Astrophys. J. 697, 1861–1869 (2009). 30. Merritt, D. The distribution of stars and stellar remnants at the Galactic Center. Astrophys. J. 718, 739–761 (2010). © 2017 Macmillan Publishers Limited, part of Springer Nature. All rights reserved.
  • 5. LetterRESEARCH Methods We used data from the Chandra X-ray Observatory (CXO). Following previous survey analyses11 only data from the ACIS-I instrument were used. There were 45 observations pointing at or near Sgr A*​providing a total cleaned exposure of 1.4 Ms. This is a 40% increase in exposure time over the most recent and updated (hereafter Muno) source catalogue11 , although all of the sources we analysed are listed in the Muno catalogue. 1σ errors are quoted for parameter uncertainties throughout the paper. Point source selection. We selected all point sources in the Muno catalogue within a circle of radius r =​ 100″​(about 4 pc) centred on Sgr A*​. We checked to ensure that these point sources were not embedded in X-ray filaments or molecular clouds. We excluded all known sources of transient outbursts such as neutron-star low- mass X-ray binaries (NS-LMXBs). The region at r <​ 5″​(less than about 0.2 pc) was also excluded because of very high background contamination and owing to the ­complex X-ray morphology that enhanced difficulties with isolating the true properties of the point sources; this region includes Sgr A*​, the IRS 13 star-forming complex and PWN G359.96−​0.04. This left 415 point sources from the catalogue out to r <​ 100″​. Sources with C ≥​ 200 (41 sources, 10%) after background subtrac- tion could be spectrally fitted individually. Analysis with hardness ratio (colour) was possible for sources with C ≥​ 50 (211 out of 415, 51%). However, most of our analysis was done for sources with C ≥​ 100, because it is increasing difficulty to distinguish between hard and soft sources as the count rate decreases. Source and background extraction. For each source, ACIS Extract (AE) ­(version AE 2016Sept22; ref. 31) was used to extract source photons from a circle containing 90% of the encircled energy fraction (EEF), typically with 1″​radius, centred on each source. All available observations from years 2003–2014 were used. For each Chandra observation, AE provides event and image files for the source, spectral files including source and background spectra, response matrix and effective area files, and light curves. We investigated various methods of background extraction and adopted the following source/background extraction methodology as optimal (and later validated by our MARX simulations) in the crowded Galactic Centre region where background is not spatially uniform. For background subtraction, AE defines an inner annulus at 1.1 times the 99% EEF radius (typically 2.5″​) so that source photons from the wings of the point spread function do not strongly contaminate background estimates. The outer radius of the background annulus is increased until the ratio of its area to the area of the source extraction region reaches an optimum preset value (= 5) as recommended in AE. The outer radius of the background annulus can vary over a range of about 3.5″ to 5″ because as additional sources are encountered from the inputted region source list, AE automatically excludes those sources and subsequently increases the outer radius until the optimum preset value of background-to-source area ratio is reached. After AE processing, we further excluded point sources with very high background counts (usually from other nearby point sources) from our analysis. Extended Data Fig. 4 illustrates our source and background extractions for one of the 12 soft sources (source 5 in Extended Data Table 1) located in the Rockefeller Ridge, the most source-crowded region we analysed. Spectral analysis. We applied four different methods of spectral analysis: the Chandra-defined hardness ratio (such as X-ray colour or slope) HR2 =​ (CH −​ CL)/ (CH +​ CL), where CH and CL are the net counts in the 2–4-keV and 4–8-keV bands, respectively; colour–colour diagrams using HR2 and HR3 =​ (CH −​ CL)/(CH +​ CL), where CH and CL are now the net counts in the 1–3-keV and 5–8-keV bands; spectral fitting of individual sources, with net count C ≥​ 200; and spectral fitting of stacked source spectra. We performed all spectral fitting and calculated hardness ratios using XSPEC version 12.932 . We adopted the tbabs model and the previously reported33 abundance data to take into account interstellar absorption. In addi- tion, the Chandra simulation tool (MARX version 5.3.1) was used ­extensively34 . MARX allows simulated sources with pre-defined spectra to be added directly into the multiple-observation Chandra data that we analysed, with their actual backgrounds, in the Galactic Centre. MARX was used to simulate non-thermal power-law spectra to assess efficiency for recovering the proper photon index and hardness ratios as a function of source brightness, in the actual Chandra Galactic Centre data. Finally, the standard XSPEC simulation tool fakeit was used to ­determine HR2 and HR3 for various source spectra, to investigate the effects of dust scattering on hardness ratios and power-law photon indices and to investigate any degeneracy between photon index determination and column density. Hardness ratio analysis. We use hardness ratio analysis to determine whether the point source population is composed of spectrally distinct components. Hardness ratios permit assessment of spectral properties of fainter sources than would be ­possible with spectral fitting. Previous work15 has established that HR2 is an ­effective diagnostic for distinguishing magnetic cataclysmic variables (mCVs) with thermal spectra from millisecond pulsars, neutron-star binaries and black- hole binaries with non-thermal spectra. mCVs are known to emit as an optically thin plasma of approximate temperature 8–40 keV with an accompanying iron-line ­complex at E ≈​ 6–7 keV (ref. 13). This is in contrast to the populations of millisecond pulsars, neutron-star binaries and black-hole binaries, which exhibit their true non-thermal power-law spectra with photon indices of Γ ≈​ 1–2.5 (refs 12, 23). On the basis of simulations of Chandra spectra, we adjusted the energy bands of HR2 so that the largest distinction between the thermal and non-thermal models could be obtained. Our resultant definition of HR2 differs slightly from that used previously15 . HR2 =​ 0.3 was adopted as the dividing line between the thermally emitting mCVs (HR2 >​ 0.3) and the non-thermal source populations (HR2 <​ 0.3). Because higher HR2 corresponds to spectrally harder sources, mCVs appear harder in the Chandra bandpass even though they have thermal spectra. More recent work6,13,35 has shown that the mCVs in the Galactic Centre are in fact completely dominated by a sub-class of mCV called intermediate polars (IPs); henceforth, we use that designation for the thermal source population characterized by HR2 >​ 0.3. We performed XSPEC simulations to establish the conversion from photon index to HR2, for a range of neutral hydrogen column densities typical of the Galactic Centre ((6–17) ×​ 1022 cm−2 ; refs 36, 37). XSPEC simulations were also used to determine at what HR2 typical IPs with kT ≈​ 8–40 keV would appear. For this simulation, we chose four canonical IPs (V709 Cas, NY Lup, V1223 Sgr and TV Col), representative of a range of plasma temperatures and neutral hydrogen column densities associated with an accretion curtain at the distance of the Galactic Centre (8 kpc)10 . In all cases the IPs had HR2 >​ 0.3. For reference, HR2 =​ 0.3 corresponds to Γ =​ 1.5 for non-thermal spectra with a hydrogen column density of NH =​ 14 ×​ 1022 cm−2 , the median of the range of values in the Galactic Centre. This Γ is typical for the majority of NS- and BH-LMXBs, and rMSPs12,23,38 . The HR2 distribution for 1 pc <​ r <​ 3.8 pc has two extreme outliers (CXO J174540.20−​285900.8 and CXO J174537.98−​290134.5), at HR2 values of − . − . + . 0 74 0 13 0 13 and− . − . + . 0 56 0 09 0 09 , respectively. These sources are not considered to be IPs or non-thermal sources (see below), but they cannot be excluded from the Kolmogorov–Smirnov (KS) test because they lie in a range of HR2 where, with their errors, they could contribute to the r <​ 1 pc HR2 distribution. However, because these are the only two outliers at HR2 <​ 0.3, out of the 66 sources for 1 pc <​ r <​ 3.8 pc, there can be at most 1 out of the 12 HR2 <​ 0.3 sources for r <​ 1 pc that arises from the 1 pc <​ r <​ 3.8 pc population. This is an extremely conservative estimate. Using the errors on the two HR2 outliers and on all of the r <​ 1 pc sources, there is only an approximately 2% chance that even one of the HR2 <​ 0.3 sources for r <​ 1 pc is from the same source population(s) as the 1 pc <​ r <​ 3.8 pc sources. Given the results of the KS test, we performed a parametric test to confirm that the source population for r <​ 1 pc is different from that (or those) for 1 pc <​ r <​ 3.8 pc. Extended Data Fig. 3 shows the radial distribution of HR2 for the sources with C ≥​ 100 as a function of projected distance from Sgr A*​. The errors on the HR2 determination are normally distributed, as determined by simulations, so a standard χ2 test can be applied to test for the constancy (expected for an IP population) of HR2 as a function of distance from Sgr A*​. Fitting a function HR2(r) =​ constant to the data for r >​ 1 pc yields the best-fitting HR2 of 0.59. The fact that the reduced χ2 value (χ = .ν 1 392 for 63 d.o.f.) exceeds 1 suggests that the spectral hardness data are intrinsically scattered, probably owing to the spread of the IP temperature distribution, which is typically in the range kT ≈​ 8–40 keV. We estimated the systematic errors associated with the intrinsic HR2 distribution of r >​ 1 pc sources by taking the Gaussian quadrature difference between the total variances and the statistical errors. We found that the systematic errors (about 8%) are subdominant compared to the statistical errors (about 20%). To test the ­hypothesis of a bifurcation in the HR2 distribution at r <​ 1 pc, we fitted a constant HR2 function to the sources for 0.2 pc <​ r <​ 3.8 pc, taking into account the ­systematic and statistical errors. The fit gives a large χ2 value (χ = .ν 3 02 for 89 d.o.f., P =​ 1.1 ×​ 10−19 ), which establishes the non-constancy of HR2 and thus the ­presence of a different source population for r <​ 1 pc. The outliers were excluded in this analysis of HR2 spatial constancy because their HR2 values are more than 5σ from even the lowest HR2 (with error) from the 64 other 1 pc <​ r <​ 3.8 pc sources. However, consistent with the KS test, one HR2 <​ 0.3 source at r <​ 1 could be associated with the r >​ 1 pc source population(s). Because the χ2 test is ­parametric and depends on the assumption of spatial constancy of the dominant IP population, it is weaker than the non-parametric KS test, which makes no assumptions about the spatial dependence of HR2 and includes the outliers; but it provides additional confirmation of the newly identified population for r <​ 1 pc. The two outlier sources have sufficient counts to enable us to fit their Chandra spectra. Fitting with an absorbed power-law model yields very soft photon indi- ces (Γ >​ 4), indicating thermal X-ray spectra. The source CXO J174540.20−​ 285900.8 fits well to an absorbed blackbody model with kT ≈​ 0.5 ±​ 0.1 keV. The best-­fitting blackbody temperature is consistent with persistent thermal emission of a ­magnetar with typical temperatures of kT ≈​ 0.3–0.5 keV (ref. 39). The other source (CXO J174537.98−​290134.5) exhibits several emission lines in the energy range E ≈​ 2–3 keV and its spectrum fits to an absorbed, optically thin thermal plasma (tbabs*apec) model with best-fitting temperature kT =​ 0.8 ±​ 0.1 keV. © 2017 Macmillan Publishers Limited, part of Springer Nature. All rights reserved.
  • 6. Letter RESEARCH This source is probably a dwarf nova, given that its temperature is lower than those of IPs and polars. The two outliers are not shown in Fig. 3 and Extended Data Fig. 3. Colour–colour analysis. One systematic uncertainty that must be addressed in both the hardness ratio analysis and the spectral analysis is the possible ­degeneracy between hydrogen column density and spectral hardness/softness. There are spatial variations in the hydrogen column density in the Galactic Centre. These ­variations can cause an intrinsically hard source at low NH in the Chandra bandpass to be misidentified as a more highly absorbed soft source, because both may yield the same HR2. We investigated whether this degeneracy could lead to systematically lower HR2 values in the central parsec. The degeneracy would also affect the spectral analysis, as discussed below. To evaluate the possibility of degeneracy affecting our analysis, we resorted to colour–colour plots, a method that is com- monly used to estimate the severity of absorption effects. For this investigation the second colour HR3 was used, because it utilizes the 1–3-keV energy band and so is more sensitive to hydrogen column density than is HR2, which focuses on higher-energy X-rays. To assess the sensitivity of HR3 to absorption effects, the XSPEC routine fakeit was used to generate simulated Chandra spectra of both IP thermal spectra at kT =​ 8–40 keV and non-thermal power-law spectra with Γ ≈​ 1–2.5. XSPEC simulations were used to calculate HR2 and HR3 for the input spectra. They demonstrated that an intrinsic HR2 >​ 0.3 source could only appear as an apparent HR2 <​ 0.3 source, owing to lower column density, if HR3 ≤​ 0.6. On the contrary, HR2 <​ 0.3 sources always have HR3 ≥​ 0.9. Extended Data Fig. 5 shows a HR2–HR3 scatter plot of all of the sources, differentiating those for r <​ 1 pc (cyan) and those for r >​ 1 pc (red). With the exception of two sources (which are intrinsically hard sources with low NH ≈​ 1022 cm−2 , on the basis of spectral fitting), all of the HR2 <​ 0.3 sources have high HR3, confirming that they are intrinsi- cally soft spectral sources rather than hard sources (intrinsic HR2 >​ 0.3) with low column density masquerading as low-HR2 soft sources. In fact, the systematics of the absorption are such that very high column densities would cause intrinsically low-HR2 sources to appear as higher-HR2 sources with high HR3. Thus the HR2 analysis of the number of soft sources for r <​ 1 pc is conservative. Quantile hardness ratio analysis. More recently, extensive use has been made of quantile analysis14,35 instead of the colour–colour analysis of Extended Data Fig. 5. Quantile plots have been shown to be more effective in breaking photon index (hardness ratio)–hydrogen column density degeneracies. Extended Data Fig. 6 shows the same data as in Extended Data Fig. 5, but in a quantile plot. Here Qn is the energy within which n% of the photons in the 2–8-keV band are contained and m is the median energy below which 50% of the photons in the band are contained. The quantile diagram also shows contours of column density and photon index, along which the quantile parameters of the x and y axis have been calculated using an assumed non-thermal spectral shape and Chandra’s response function. The diagram clearly shows the two distinct populations of sources. Nearly all of the sources for r >​ 1 pc have Γ <​ 1 whereas about half of the sources for r <​ 1 pc have softer power-law photon indices of Γ ≈​ 1–2. The large scatter of all of the sources with column density shows no systematic bias in source hardness due to column density effects. Spectral analysis of individual, bright Chandra sources. A spectral ­analysis, albeit available for only a smaller number of sources (13 for r <​ 1 pc and 28 for 1 pc <​ r <​ 3.8 pc) provides a second method for confirming the presence of distinct source populations inside and outside 1 pc. We fitted Chandra spectra of the sources with sufficient net counts (C ≥​ 200) using thermal (tbabs*pcfabs*apec) and non-thermal models (tbabs*powerlaw) in XSPEC. Spectral bins were adap- tively re-binned so that the counts in each bin have at least 3σ statistical significance over background. Outside r =​ 1 pc, 16 of the 28 HR2 >​ 0.3 sources with C ≥​ 200 are well fitted by a thermal model with kT ≈​ 5–10 keV. These brighter sources, as demonstrated by the example shown in Extended Data Fig. 1a, clearly exhibit broad iron lines at 6–7 keV, characteristic of mCVs. The fainter 10 HR2 >​ 0.3 sources are well fitted by hard power-law models with Γ <​ 1. Previous studies15 with Chandra also found that faint mCVs are readily fitted by power laws with Γ ≈​ 0–1. In contrast, inside r =​ 1 pc, the five HR2 <​ 0.3 sources with C ≥​ 200 are well fitted by a power-law model with Γ ≈​ 1.5–2 and no apparent iron lines. Extended Data Fig. 1b shows the spectrum of a bright HR2 <​ 0.3 source with C =​ 267 fitted to a power-law model with Γ =​ 1.9 ±​ 0.3. Of the seven HR2 >​ 0.3 sources, similarly to the case of r >​ 1 pc sources, the five bright sources are well fitted by a thermal model with broad iron lines and the two fainter sources by a power-law model with Γ <​ 1. Using the logN–logS values measured for both of the soft sources, and a much larger sample of hard sources (IPs) in the Galactic Centre (N(>​S) =​ kS−α , α =​ 1.4)35 , we expect around four soft and eight hard sources inside r =​ 1 pc to have sufficient counts for spectral analysis. These numbers are roughly consistent with the five soft and seven hard sources inside r =​ 1 pc that we found that are amenable to spectral fitting. MARX simulation. To validate our source/background extraction method and the subsequent spectroscopy and colour photometry, we employed MARX simulations followed by AE analysis. MARX simulation allows us to input sources, represent- ing mCVs and BH-LMXBs, on top of the diffuse, gaseous structures in order to assess whether we can recover the proper input spectrum and the input HR2 hard- ness ratios within statistical uncertainties. We generated fake point sources with input power-law spectra with Γ =​ 1.5–2. Input X-ray fluxes were adjusted to give C =​ 100–200 in the 2–8-keV band, similar to those of the 12 HR2 <​ 0.3 sources for r <​ 1 pc (Extended Data Table 1). In each MARX simulation, 5–10 fake sources were added to all 45 Chandra observations at various source-free locations within 0.2 pc <​ r <​ 1 pc including the ridge detected by ref. 40 (representing one of the highest background regions in r ​ =​0.2–3.8 pc). This is the most realistic simulation because we take into account the actual background, vignetting, point spread func- tion and dithering effects for all 45 Chandra observations used for data analysis. A total of 124 hard and soft sources were run at 32 positions at r ​ <​ 1 pc. The MARX sources were placed as close as possible to the observed sources whenever feasible. Often a MARX simulation was run repeatedly at a given position to build up sta- tistics on photometry and spectral recovery in the face of counting statistics. We analysed the simulated Chandra data using AE, calculated hardness ratios of the fake sources and performed spectral fitting with XSPEC. We recovered the (soft) input HR2 values within statistical errors for 65 out of 67 simulated sources with C  ​ 100. Thus, the probability of misidentifying an intrinsically soft source (HR2 < 0.3) as a hard source (HR2 > 0.3) is about 3%. More importantly, the prob- ability for hard sources (with IP thermal spectra) with C  ​ 100 being misidentified as soft sources was about 2% (56 out of 57 simulated hard sources). Thus, at r ​ <​ 1 pc, the mean number of soft sources turning into hard sources is about 0.4 and the mean number of hard sources turning into soft sources is about 0.3. For fainter sources with C ≤​ 50, the false probability increases to more than about 20%. Thus, we conclude that the threshold for reliable, spectroscopic identification between non-thermal X-ray sources and IPs is C ​ 100 throughout the 0.2 pc <​  r ​ <​3.8 pc region we analysed. Scattering effects on spectral analysis. Owing to dust scattering of X-ray photons, a point source can appear with a diffuse halo that extends beyond a ­typical source-extraction region41 . Dust scattering haloes have been detected from Chandra observations of bright X-ray transients (such as AX J1745.6−​290142 and Swift J174540.7−​29001543 ). Because the dust scattering is more substantial at low energy, the X-ray spectrum of a source may appear harder if scattered photons are not fully collected within an extraction region. For example, a non-thermal power-law X-ray spectrum could be hardened by up to Δ​Γ ≤​ 0.5 when NH >​ 1023 cm−2 (ref. 44). Unlike bright X-ray transients, no dust scattering halo is observed from the (fainter) Chandra X-ray sources because it is buried under diffuse X-ray background in the Galactic Centre. To assess the effects of dust scattering, we applied a spectral model42 . The model parameters, such as grain sizes and types, column densities and distances of dust layers, have been uniquely determined by fitting the Chandra radial profiles of the outbursting NS-LMXB AX J1745.6−​2901, which lies 1.5 arcmin away from Sgr A*​. The model requires a foreground dust layer in the spiral arms a few kiloparsecs away from the Galactic Centre and another layer closer to AX J1745.6−​2901. The foreground dust layer with NH ≈​ 1.7 ×​ 1023 cm−2 is likely to lie in the line of sight for other X-ray sources within a few arcmin of Sgr A*​ (ref. 42). We simulated Chandra ACIS-I spectra that correspond to our source-­extraction size (typically 1″​) using various input spectral models, including a power-law with Γ ≈​ 1–2.5 (representing non-thermal sources) and a partially covered APEC model with kT ≈​ 20 keV (representing typical IP-like spectra). For each spectral model, we simulated Chandra ACIS-I spectra with and without the multiplica- tive ­fgcdust ­scattering model in XSPEC. Then, we calculated HR2 hardness ratios. We also fit power-law (tbabs*powerlaw) and thermal (tbabs*pcfabs*apec) models to the ­simulated spectra of non-thermal and thermal sources, respectively. The differences in the best-fitting HR2 values, power-law indices and temperatures between the simulated Chandra spectra with and without the dust scattering model ­provide an estimate for how much spectral hardening could be caused by typical dust scattering in the Galactic Centre. Regardless of the input model, thermal or non-thermal, dust scattering hardens HR2 by Δ​HR2 =​ 0.1. Thus, our hardness selection using HR2 is relatively unaffected by dust scattering for the relevant spectral types. The net effect of dust scattering is to harden non-thermal and thermal Chandra spectra by Δ​Γ =​ 0.3 (consistent with previous results44 ) and Δ​kT =​ 0.5 keV, respectively. Stacked spectra analysis. That the HR2 cut produces two distinct source ­populations is further supported by an analysis of stacked Chandra ACIS spectra in the central parsec. Using the combine_spectra command in the Chandra analysis software CIAO, we combined source and background spectra files for each group of the HR2 <​ 0.3 and HR2 >​ 0.3 sources. We excluded several sources from the © 2017 Macmillan Publishers Limited, part of Springer Nature. All rights reserved.
  • 7. LetterRESEARCH stacked spectra because their very high background counts are dominant and so lower the signal-to-noise ratios. Figs 2a and b in the main text show the stacked spectrum of the 8 HR2 >​ 0.3 sources with strong Fe lines and 12 HR2 <​ 0.3 sources, respectively. In both cases, all sources have net counts C  ​ 100 and they are located in the central parsec. First, we fitted an absorbed power-law model (tbabs*powerlaw) to both stacked Chandra spectra. To accurately determine the spectral parameters and column density NH, we applied the multiplicative fgcdust dust scattering model41 . The stacked Chandra spectra of the HR2 <​ 0.3 sources in the central parsec are well fitted (χ = .ν 0 812  , d.o.f. =​ 51) by an absorbed power-law model yieldingΓ = . − . + . 1 9 0 3 0 3 and = . ×− . + . −N 0 8 10 cmH 0 2 0 2 23 2 (Fig. 2b). We found that the 14 HR2 > 0.3 sources at r ​ < 1 pc divide into two subgroups with different spectral characteristics: 8 of them exhibit strong Fe lines in their Chandra spectra, while the other 6 sources show either no or weak Fe lines. An absorbed power-law model fit to both stacked spectra yields a hard photon index of Γ ≈ 0.6–0.7. The hard photon index (Γ ​1) is a common signature of IPs45 . The power-law model yields a poor fit to the stacked spectra of the 8 HR2 >​ 0.3 sources with strong Fe lines (χ = .ν 1 902 for 39 d.o.f.). Since the IP spectra are physically best modelled as emission from an optically thin thermal plasma, we employed the APEC model in XSPEC. We added a partial-covering absorption model (pcfabs) to account for photo-absorption in the accretion curtain or X-ray reflection from the white dwarf surface and a Gaussian line component for the neutral Fe-K fluorescence line13 . Using this fiducial IP spectral model, that is, fgcdust*tbabs*fcfabs*(apec+gauss), the stacked Chandra spectra of the 8 HR2 > 0.3 sources with strong Fe lines fit well, yielding the best-fit temperature of = . − . + . kT 6 3 keV1 7 1 6 (Fig. 2a), while the stacked Chandra spectra of the 6 HR2 > 0.3 sources with no Fe lines fit to a significantly higher temperature (​kT = 19−10 keV). In the latter case, the temperature is not well constrained owing to the lack of Fe lines in the Chandra energy band below 8 keV. It is likely that the HR2 > 0.3 sources are composed of 8 IPs with ​kT ≈ 5–8 keV (with Fe lines) and 6 IPs with higher temperatures where the Fe complex is over-ionized. The overall stacked spectrum of all 14 HR2 > 0.3 sources fits to a partially coveredthermalmodelwell(χ = .ν 0 802  ,d.o.f. = 58),yieldingthebest-fittemperature of = . − . + . kT 7 3 keV1 3 3 0 (Extended Data Fig. 7). The best-fit Fe abundance = . − . + . A 0 6Fe 0 2 0 3 (relative to solar) is consistent with previous spectral fits for the unresolved, diffuse IP component of the CHXE6,13 . Our results from the best-fit models are summarized in Extended Data Table 2. The best-fit plasma temperature of = . − . + . kT 7 3 keV1 3 3 0 represents an ensemble of IPs with different temperatures and it is consistent with the stacked spectra of the HR2 > 0.3 sources for 1 pc <​ r <​ 3.8 pc ( = . − . + . kT 5 5 keV)0 3 0 6 as well as the results from ref. 6 ( = . − . + . kT 7 5 keV1 3 1 5 ) and ref. 15 (kT ≈​ 7–9 keV). Hard and soft spectrum background systematics. Here we address whether the spectral difference between the soft and hard sources could be due to non-uniform background in the Galactic Centre region or to thermal hotspots in the diffuse emission. Extended Data Fig. 8 shows the stacked background spectra for both the HR2 < 0.3 sources and HR2 > 0.3 sources (with C ≥ 100). They do not fit a power-law model with large χ ≈ .ν 3 42 –3.6 owing to the emission lines at 2–4 keV (from low-Z elements) and 6–7 keV (from Fe). Both background spectra fit well with an absorbed two-temperature APEC model yielding χ ≈ .ν 1 22 –1.4. The best-fit temperatures are consistent between the two background spectra: = . − . + . kT 0 93 keV1 0 04 0 10 and = . − . + . kT 5 9 keV2 2 9 1 5 (for the soft source back- ground) and = . − . + . kT 1 18 keV1 0 04 0 05 and = . − . + . kT 6 6 keV2 1 1 1 5 (for the hard source background). Thus the spectrally distinct nature of the HR2 < 0.3 and HR2 > 0.3 sources cannot be attributed to spectral variations in the background, and their backgrounds are not consistent with non-thermal spectra. Spurious power-law spectra could result from subtracting thermal background spectra from ‘hotspots’11 . These point-like hotspots are possibly due to small-scale density variations (about 0.1 pc) in the (thermal) diffuse emission in the Galactic Centre. They are speculated11 to be the origin of a thermal point source excess for low-flux sources in the Galactic Centre. These should become significant only at fluxes that corresponds to C ≤ 40, about 3–7 times below the net counts of the HR2 < 0.3 sources. Nevertheless, we investigated the possibility that subtracting a similar background spectrum from a hotspot thermal spectrum could produce a power-law spectrum. Using the measured background for the HR2 < 0.3 sources, XSPEC simulations were run for simulated thermal sources with plasma temper- atures (kT2 = 3.5–8 keV) and abundance (Z2 = 0.3–1.5) encompassing those observed in the central few parsecs. The source normalization was adjusted to correspond to our observed source net counts. Using the same rebinning and fitting procedures as for our overall analysis, we found that the stacked spectrum for the 12 simulated thermal hotspots was indeed a power law, but with best-fit photon indices of Γ = 2.5–4, steeper than our observed HR2 < 0.3 sources (Γ = . − . + . 1 9 0 3 0 3 ). We could only get closer to our observations by adjusting the net counts to be well below our 100-count threshold. And in almost all cases including the best-fit photon indices Γ ≈2.5, the spectra showed strong emission lines at 2–4 keV and 6–7 keV (see typical example in Extended Data Fig. 9). Consequently, all the fits were poor with an absorbed power-law model (χ ≈ .ν 1 42 –1.8 with approximately 50–60 d.o.f.) and, owing to the emission lines, looked nothing like our featureless spectra of the HR2 < 0.3 sources. Variability study. For the 12 HR2 < 0.3 point sources within r < 1 pc, we eval- uated their X-ray variability by applying the Bayesian-Block (BB) algorithm46 to the unbinned photon arrival times after removing time gaps between the Chandra observations spanning around 12 years. No exposure map or vignetting effect correction is required because we verified that none of the sources at r ​ < 1 pc are near the chip gaps and all 45 observations were pointed at Sgr A*. The BB algorithm is more sensitive to short-term variability than the KS test, which evaluates the sta- tistical significance of variability over the full time interval. Our analysis followed ref. 46. Among the 12 HR2 < 0.3 X-ray sources, 6 sources (50%) were variable at the 90%–99% confidence level (Extended Data Table 1). Since the BB algorithm works on source and background events, we did an independent timing analysis on nearby regions to ensure that variability was not due to time varying background. Although BH-LMXBs and rMSPs both exhibit non-thermal X-ray spectra, X-ray variability can be used to distinguish between them. Most (around 70%) of the known BH-LMXBs observed in the quiescent state on multiple occasions have shown evidence of X-ray flux variability, many by a factor of 2–5 over a times- cale of days to years, owing to accretion23 . On the other hand, rMSPs display no such long-term variability. Whereas a majority of rMSPs emit thermal X-rays with blackbody temperatures of kT <​ 0.3 keV originating from the polar caps, non-thermal X-ray emission has been detected from about 30% of rMSPs24,47,48 . The population of rMSPs with only soft thermal emission, if they are located in the Galactic Centre, are not ­observable in the X-ray band because the soft thermal X-ray emission of this population will be completely absorbed owing to high col- umn density NH ≈​ 1023 cm−2 . The ­population with non-thermal emission, which represents just over one-third of all approximately 50 known rMSPs detected in the X-ray band, exhibit power-law spectra with Γ =​ 1–1.5 and LX ≈​ 1030 –1033 erg s−1 . The non-thermal X-ray emission from rMSPs originates either from the magne- tosphere or from an intra-binary shock (for rMSPs in binary systems)24,48 . Orbital variability has sometimes been detected owing to eclipsing from the companion48 . Isolated MSPs do not show X-ray variability on timescales greater than their mil- lisecond spin periods because non-thermal X-rays are emitted from the magne- tosphere24 . On the other hand, non-thermal X-ray emission from binary rMSPs often exhibits modulation over the orbital periods of these sources (hours to a few days); but these sources do not show the long-term variability that is observed for many of the Chandra point sources in the Galactic Centre. Thus, the detec- tion of long-term variability over months or years in the Chandra sources can be used as a strong indicator against rMSPs. On the other hand, timing studies of nearby qBH-LMXBs show that about 30% of them do not show variability and one would expect an even larger fraction to appear ‘steady’ at the great distance of the Galactic Centre, where variability is harder to detect and poorly constrained in fields of high background. Based on this variability argument, one-half or less of the HR2 < 0.3 sources may be rMSPs. Population analysis. Flaring emission from the coronae of main-sequence stars has been proposed previously to account for a substantial fraction of the soft-X-ray emission in the Galactic Centre, but only in the central approximately 0.1 pc (ref. 22). The mean luminosity of these stars in the quiescent state is more than three orders of magnitude below our sensitivity limit and, even when flaring, a factor of about 30 below our sensitivity limit (1028 –1030 erg s−1 )22 . The active stellar binaries (RS CVn, BY Dra and Algols) are similarly excluded because even objects in the bright RS CVn class have a luminosity of about 1030 –1031 erg s−1 , more than about three times below the detection threshold22 . Moreover, because the stellar mass inside 1 pc is 40% less than that in the 1 pc <​ r <​ 3.8 pc annulus and X-ray emitting stars are not present in the annulus, the contribution of stars inside 1 pc must be negligible. Spatial morphology. We extracted the power-law index for the three-dimensional density n(r) of soft (HR2 <​ 0.3) sources by using the assumed form n(r) =​ kr−γ and projecting this along the line of sight to obtain a best fit to the surface density Σ(R) =​ kR−β . The appropriate integral is ∫Σ ρ= − − /R r r r R r( ) 2 ( )( ) d2 2 1 2 , where r and R are the actual and projected distances from Sgr A*​, respectively. We used a Python fitting routine in the scipy.optimize.curve_ fit package. For the qBH-LMXB candidates this gives γ = . − . + . 2 4 0 3 0 3 . If the steady rMSP candidate sources are removed, a slightly shallower cusp results, with γ = . − . + . 2 0 0 7 0 7 . We also included fainter sources with C ≥​ 50 to estimate the radial extent of the soft source distribu- tion without the rMSP candidates. This yields a power-law index of γ = . − . + . 1 5 0 5 0 5 . The stellar cusp was recently detected49 in the population of old stars in the Galactic Centre and at a comparable projected distance range to that explored here, but had an associated power-law fit with a comparable cusp of γ =​ 1.5. © 2017 Macmillan Publishers Limited, part of Springer Nature. All rights reserved.
  • 8. Letter RESEARCH Total number of non-thermal sources in the central parsec. We used the logN– logS plot in Extended Data Fig. 2 to estimate the total number of non-thermal sources. The extrapolation to fainter sources below the Chandra flux threshold was based on a previously reported intrinsic luminosity distribution50 . The slope of this distribution (α = . − . + . 1 4 0 1 0 1 ) is in agreement, within errors, with that measured for the qBH-LMXB candidates in the central parsec (α = . − . + . 1 8 0 2 0 2 ). A cross-check on the logN–logS results can be obtained by using the measured slope for the soft, r <​ 1 pc sources to calculate the mean luminosity per source, assuming that the logN–logS plot extends down to the faintest qBH-LMXB observed50 locally. We have ∫ ∫/ = /L N N L L L N L L(total) ( ) d ( )d , where N(L) =​ dN(>​L)/dL and the lim- its of integration are set by the previously used value48 of Lmin and the intrinsic luminosity of the brightest soft source that we observed in the central parsec. This gives 〈​L〉​ =​ 4 ×​ 1031 erg s−1 for the soft sources of the central parsec, in good agree- ment with the previously observed50 mean luminosity of 5 ×​ 1031 erg s−1 . However, the estimate of the total non-thermal source population should be viewed with caution. It is based on the value of Lmin of a small sample (18) of relatively nearby black-hole binaries and it is unclear how representative these are of the qBH- LMXBs of the Galactic Centre. As an example, increasing Lmin by a factor of two would reduce the extrapolated number of sources by a factor of about three. Although we cannot rule out that the steady sources that comprise one-half of our non-thermal sources in the central parsec are rMSPs, we might expect them to have a more extended spatial distribution, because neutron stars receive substantial kick velocities on formation. Even when situated in binaries, and taking into account the higher escape velocity in the Galactic Centre, a more extended distribution, beyond 1 pc, for the rMSP population is likely. However, because rMSPs are an old population, those that have escaped the centre may be located at much larger distances than the 3.8 pc to which our analysis extends. Those in the central parsec are the fraction that did not have sufficient kinetic energy to escape. In fact, all of our observations are within the approximately 3-pc influ- ence radius in the Galactic Centre. Detailed modelling is required to resolve these questions. Transient emission from the qBH-LMXB. Four X-ray binary transients were previously reported in the central parsec, representing an over-density per unit stellar mass of about 20 times compared to the surrounding tens of parsecs25 . Subsequent work established that three of those transients are NS-LMXBs, ­leaving one potential BH-LMXB candidate in the central parsec, which has had only its original large outburst in more than a decade of monitoring17,18 . More recently, ­several new transients that are strong BH-LMXB candidates have been identified in the Galactic Centre (K.M., C.J.H., D. Haggard, B.J.H., C. Jin, S. Mandel, M. Nynka, G. Ponti and J. Tomsick, manuscript in preparation). If qBH-LMXBs have large outburst recurrence times of about 100 years, then in more than 10 years of ­monitoring 40 or more outbursts would have been expected from the extrapolated qBH-LMXB population, which is clearly inconsistent with observations. If the recurrence time is about 1,000 years, then there is rough consistency between the number of BH-LMXB transients observed in the central parsec over the more than 10 years of monitoring, and the non-detection of large outbursts among the dozen X-ray binaries reported here. Such a long recurrence time may not be implausible. Observations of the local qBH-LMXB population reveal a correla- tion between luminosity and orbital period, such that the sources below our flux threshold all have orbital periods P of less than about 10 h. But according to the accretion disk instability model, very faint systems with P less than about 10 h are precisely those whose accretion rate is below the critical rate required to induce large outbursts. If they are accreting at around 10−3 times the critical accretion rate, then recurrence times of around 1,000 years are realized. The qBH-LMXBs above our detection threshold are both brighter and, according to the LX–P correlation, should have longer periods. They would therefore burst at a higher rate, but still be ­consistent with the non-observation of large outbursts from their locations. A similar ­argument, based on a low accretion rate leading to a lack of recurrent outbursts, has been used to explain the inefficiency of X-ray searches in uncov- ering black hole–Be binaries51 . No such problem arises for rMSPs, which do not have outbursts. Code availability. We used standard software for all our data analysis: the Chandra Interactive Analysis of Observations (CIAO; http://cxc.harvard.edu/ciao/), the MARX simulator (http://space.mit.edu/CXC/MARX/), the ACIS Extract package (http://personal.psu.edu/psb6/TARA/AE.html) and NASA’s HEASOFT software (https://heasarc.nasa.gov/lheasoft/). Data availability. The Chandra data that support the findings of this study are available from NASA’s HEASARC data archive (https://heasarc.gsfc.nasa.gov/docs/ archive.html). The data shown in the figures and tables are available from the corresponding author on reasonable request. 31. Broos, P. S. et al. Innovations in the analysis of Chandra-ACIS observations. Astrophys. J. 714, 1582–1605 (2010). 32. Arnaud, K. A. XSPEC: the first ten years. ASP Conf. Ser. 101, 17–20 (1996). 33. Wilms, J., Allen, A. & McCray, R. On the absorption of X-rays in the interstellar medium. Astrophys. J. 542, 914–924 (2000). 34. Davis, J. E. et al. Raytracing with MARX: X-ray observatory design, calibration, and support. Proc. SPIE 8443, 84431A (2012). 35. Hong, J. et al. NuSTAR hard X-ray survey of the galactic center region. II. X-ray point Sources. Astrophys. J. 825, 132 (2016). 36. Sakano, M. et al. Unusual X-ray transients in the Galactic Centre. Mon. Not. R. Astron. Soc. 357, 1211–1218 (2005). 37. Ponti, G. et al. A powerful flare from Sgr A*​confirms the synchrotron nature of the X-ray emission. Mon. Not. R. Astron. Soc. 468, 2447–2468 (2017). 38. Takata, J., Cheng, K. S. & Taam, R. E. X-ray and gamma-ray emissions from different evolutionary stage of rotation powered millisecond pulsars. Astrophys. J. 745, 100 (2012). 39. Kaspi, V. M. & Beloborodov, A. M. Magnetars. Annu. Rev. Astron. Astrophys. 55, 261–301 (2017). 40. Rockefeller, G., Fryer, C. L., Baganoff, F. K. & Melia, F. The X-ray ridge surrounding Sagittarius A* at the Galactic Center. Astrophys. J. 635, L141–L144 (2005). 41. Overbeck, J. W. Small-angle scattering of celestial X-rays by interstellar grains. Astrophys. J. 141, 864–866 (1965). 42. Jin, C. et al. Probing the interstellar dust towards the Galactic Centre: dust-scattering halo around AX J1745.6−​2901. Mon. Not. R. Astron. Soc. 468, 2532–2551 (2017). 43. Corrales, L. R. et al. The Chandra dust-scattering halo of Galactic Center transient Swift J174540.7−​290015. Astrophys. J. 839, 76 (2017). 44. Corrales, L. et al. The dust-scattering component of X-ray extinction: effects on continuum fitting and high-resolution absorption edge structure. Mon. Not. R. Astron. Soc. 458, 1345–1351 (2016). 45. Bradley, C. K. The spectrum of the black hole X-ray nova V404 Cygni in quiescence as measured by XMM-Newton. Astrophys. J. 667, 427–432 (2007). 46. Scargle, J. D., Norris, J. P., Jackson, B. & Chiang, J. Studies in astronomical time series analysis. VI. Bayesian block representations. Astrophys. J. 764, 167 (2013). 47. Overbeck, J. W. Small-angle scattering of celestial X-rays by interstellar grains. Astrophys. J. 141, 864–866 (1965). 48. Bogdanov, S. et al. Chandra X-ray observations of the 12 millisecond pulsars in the globular cluster M28. Astrophys. J. 730, 81 (2011). 49. Schödel, R. et al. The distribution of stars around the Milky Way’s central black hole. II. Diffuse light from sub-giants and dwarfs. Astron. Astrophys. https://doi. org/10.1051/0004-6361/201730452 (2017). 50. Armas Padilla, M. et al. Swift J1357.2−​0933: the faintest black hole? Mon. Not. R. Astron. Soc. 444, 902–905 (2014). 51. Casares, J. et al. A Be-type star with a black-hole companion. Nature 505, 378–381 (2014). © 2017 Macmillan Publishers Limited, part of Springer Nature. All rights reserved.
  • 9. LetterRESEARCH Extended Data Figure 1 | Example Chandra spectra of thermal and non-thermal X-ray sources. a, CXO J174541.02−​290017.6 (HR2 >​ 0.3). b, CXO J174539.48−​290045.8 (HR2 <​ 0.3). The hard (thermal) source spectrum, which exhibits a broad emission line at E =​ 6–7 keV, is fitted by a partially covered APEC model, whereas the soft (non-thermal) source spectrum is fitted by an absorbed power-law model. The error bars represent 1σ statistical uncertainties. The bottom panels show residuals (data minus model) in terms of 1σ significance. © 2017 Macmillan Publishers Limited, part of Springer Nature. All rights reserved.
  • 10. Letter RESEARCH Extended Data Figure 2 | A cumulative X-ray flux distribution of the qBH-LMXB candidates within 1 pc. A logN–logS histogram of the 12 HR2 <​ 0.3 sources (assuming all are qBH-LMXBs) is plotted, where S denotes an absorbed 2–8-keV flux. The best-fitting power-law model is shown as a solid blue line. An extrapolation of this line to the minimum observed flux (1.9 ×​ 10−16 erg cm−2 s−1 , after correcting for higher X-ray extinction in the Galactic Centre) of the local qBH-LMXB population50 is used to estimate the total number of qBH-LMXBs in the central parsec. © 2017 Macmillan Publishers Limited, part of Springer Nature. All rights reserved.
  • 11. LetterRESEARCH Extended Data Figure 3 | Hardness ratio for X-ray point sources with C ≥ 100 as a function of the projected radial distance from Sgr A*. The horizontal line denotes the best fit to a radially constant hardness ratio (HR2 =​ 0.53), which yields a poor fit with χ = .ν 3 02 for 89 d.o.f. We took into account statistical and systematic errors in the HR2 data; the error bars in the figure indicate 1σ statistical uncertainties. The hypothesis of spatial constancy of HR2 is thus rejected with P =​ 1.1 ×​ 10−19 . The bifurcation in HR2 at r ​ 1 pc is clearly visible. © 2017 Macmillan Publishers Limited, part of Springer Nature. All rights reserved.
  • 12. Letter RESEARCH 0 0.5 1 1.5 2 2.5 3 3.5 4 4.5 5 90% 23 90% 90% 90% 27 26 24 90% 23 90% 90% 90% 27 26 24 Extended Data Figure 4 | Chandra images of the soft source CXO J174540.79−290024.5 and its extracted background events. a, Neighborhood image around the source (labelled 26, with multiple green circles near the centre indicating source extraction regions for different observations) along with other Chandra catalogue sources indicated by numbers 23, 24 and 27. b, Background image around the source (labelled 26 and located near the centre with a green circle) from ObsID 11843. The red dashed circle indicates the inner circle of the background annulus (r = 2.5″). Note that background was properly extracted from an annulus of r ≈ 2.5″–4″ by excluding the nearby Chandra sources indicated by green circles labelled 23, 24 and 27. © 2017 Macmillan Publishers Limited, part of Springer Nature. All rights reserved.
  • 13. LetterRESEARCH Extended Data Figure 5 | Colour–colour diagram of X-ray sources with C ≥ 100 within radial projected distances from Sgr A*. HR2 and HR3 hardness data are plotted for sources at r <​ 1 pc (cyan) and 1 pc < r <​ 3.8 pc (red). The error bars represent 1σ statistical uncertainties. There is no clear evidence of HR3–HR2 correlation, a surrogate for column-density- or scattering-related effects. The vertical dotted grey line indicates our dividing line at HR2 =​ 0.3 between the soft and hard sources. For reference, the calculated HR2 and HR3 for four local IPs, whose spectra were extrapolated to the distance of Sgr A*, are shown as black diamonds. They cluster at high HR2, as expected. Only three of the four IP diamonds are visible because two of them overlap. © 2017 Macmillan Publishers Limited, part of Springer Nature. All rights reserved.
  • 14. Letter RESEARCH Extended Data Figure 6 | Median photon energy in the spectrum versus hardness ratio of X-ray sources with C ≥ 100. Sources for r <​  1 pc and r >​ 1 pc are indicated in cyan and red, respectively. The median m =​ Q50 and the ratio of two quartiles Q25/Q75 are calculated for each source14 . The energy scale across the top shows the median energy values (E50%). The blue and red lines correspond to hydrogen column density NH and power-law photon index Γ grids, respectively. The error bars represent 1σ statistical uncertainties. © 2017 Macmillan Publishers Limited, part of Springer Nature. All rights reserved.
  • 15. LetterRESEARCH Extended Data Figure 7 | Stacked Chandra ACIS-I spectrum of the 14 thermal X-ray sources with net counts C ≥ 100 within r < 1 pc. The spectrum is well fitted with a partially covered thermal APEC model with a Gaussian line at 6.4 keV (χ = .ν 0 802 for 58 d.o.f.). The error bars represent 1σ statistical uncertainties. The bottom panels show residuals (data minus model) in terms of 1σ significance. The best-fit parameters are shown in Extended Data Table 2. 10−5 5×10⁻⁶ 2×10⁻⁵ 5×10⁻⁵ ctss−1keV−1 5 −2 0 2 σ Energy (keV) © 2017 Macmillan Publishers Limited, part of Springer Nature. All rights reserved.
  • 16. Letter RESEARCH Extended Data Figure 8 | Stacked background Chandra ACIS-I spectra of the sources with net counts C ≥ 100 within r < 1 pc. a, 12 HR2 < 0.3 sources. b, 14 HR2 > 0.3 sources. Several prominent emission lines are present from low-Z elements (below 4 keV) and Fe (at 6–7 keV). Both background spectra are well fitted with an absorbed two-temperature thermal APEC model: χ = .ν 1 212 (291 d.o.f.; soft source background) and χ = .ν 1 262 (320 d.o.f.; hard source background). The best-fit temperatures are consistent between the two background spectra: = . − . + . kT 0 93 keV1 0 04 0 10 and = . − . + . kT 5 9 keV2 2 9 1 5 (for the soft source background) and = . − . + . kT 1 18 keV1 0 04 0 05 and = . − . + . kT 6 6 keV2 1 1 1 5 (for the hard source background). The error bars represent 1σ statistical uncertainties. The bottom panels show residuals (data minus model) in terms of 1σ significance. a b 10−5 10−4 2×10⁻⁶ 5×10⁻⁶ 2×10⁻⁵ 5×10⁻⁵ ctss−1 keV−1 2 5 −2 0 2 σ Energy (keV) 10−5 10−4 2×10⁻⁶ 5×10⁻⁶ 2×10⁻⁵ 5×10⁻⁵ ctss−1 keV−1 52 −2 0 2 σ Energy (keV) © 2017 Macmillan Publishers Limited, part of Springer Nature. All rights reserved.
  • 17. LetterRESEARCH Extended Data Figure 9 | Simulated Chandra ACIS-I spectrum using a two-temperature thermal APEC model. The input parameters are kT1 = 1.0 keV and Z1 = 2.5 (for the lower-temperature component) and kT2 = 5.0 keV and Z2 = 0.6 (for the higher-temperature component). The spectrum was poorly fit with an absorbed power-law model yielding χ = .ν 1 652 (56 d.o.f.; hard source background) and showing large residuals at 2–3 keV and 6–7 keV. The best-fit photon index (Γ = . − . + . 3 1 0 4 0 4 ) is significantly softer than that of the stacked soft source spectrum in Fig. 2b (Γ = . − . + . 1 9 0 3 0 3 ). 10−5 10−4 5×10⁻⁶ 2×10⁻⁵ 5×10⁻⁵ ctss−1keV−1 52 −4 −2 0 2 4 σ Energy (keV) © 2017 Macmillan Publishers Limited, part of Springer Nature. All rights reserved.
  • 18. Letter RESEARCH Extended Data Table 1 | The 12 non-thermal (soft) X-ray sources with C ≥ 100 in the central parsec The last column indicates the source detection significance calculated by wavdetect, a wavelet algorithm used widely for Chandra analysis. The sources have HR2 <​ 0.3. © 2017 Macmillan Publishers Limited, part of Springer Nature. All rights reserved.
  • 19. LetterRESEARCH Extended Data Table 2 | Best-fitting parameters from fitting the stacked Chandra spectra The errors indicate 1σ statistical uncertainties. The spectral models are a partially covered APEC model with a Gaussian line and an absorbed power-law model for the 14 hard (HR2 >​ 0.3) and the 12 soft sources (HR2 <​ 0.3), respectively. The line energy and width of the Gaussian line component are fixed to 6.4 keV and 0.01 keV to account for the neutral Fe-K fluorescence line. The parameters of the partial covering absorption component are poorly constrained owing to spectral fitting in the narrow 2–8-keV energy band. © 2017 Macmillan Publishers Limited, part of Springer Nature. All rights reserved.