SlideShare uma empresa Scribd logo
1 de 24
www.infoDiagram.com 2015
1
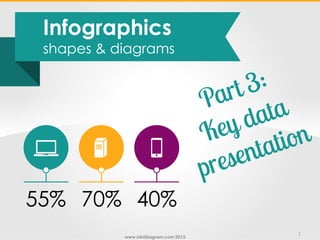
Infographics
shapes & diagrams
55% 70% 40%
www.infoDiagram.com 2015
Want to present
your key data values, KPIs
in an attractive way?
www.infoDiagram.com 2015
Want to present
your key data values, KPIs
in an attractive way?
Use key data
visualization
shapes and diagrams
www.infoDiagram.com 2015
Want to present
your key data values, KPIs
in an attractive way?
Get inspired
by the following examples…
Use key data
visualization
shapes and diagrams
www.infoDiagram.com 2015
Key data presentation
diagram placeholders
www.infoDiagram.com 2015
How to show important values in creative way?
Use infographics diagrams for presenting data
www.infoDiagram.com 2015
How to show important values in creative way?
Use infographics diagrams for presenting data
“This year key performance indicators include 123 456
products in stock, with average value of package $ 2831.
We managed to process 350 000 products in total…“
Products
processed
350 000123 456
Products
in stock
$ 2831
Product package
value
www.infoDiagram.com 2015www.infoDiagram.com 2015
123 456
Data value
name
Data value
name
Data value
name
123 456 123 456
Status of …
Some other infographics placeholders for data:
www.infoDiagram.com 2015www.infoDiagram.com 2015
Your description of the main measure
indicator
Key Performance
Indicator measure
explanation
KPI 3KPI 1
Key Performance
Indicator measure
explanation
KPI 2
Key Performance
Indicator measure
explanation
33%
market share
www.infoDiagram.com 2015www.infoDiagram.com 2015
Clients
acquired
New
countries
covered
Corporate
clients
acquired
Profit est. in
2015
Turnover est.
in 2015
Growth
rate
3 014 15 241
$ 100 000$2 439 021
39%
www.infoDiagram.com 2015www.infoDiagram.com 2015
Key data 2
Key data 3
Key data 1
www.infoDiagram.com 2015www.infoDiagram.com 2015
55% 70% 40% 60%
Your sample
text here
Your sample
text here
Your sample
text here
Your sample
text here
www.infoDiagram.com 2015www.infoDiagram.com 2015
55% 70% 40% 60%
TITLE
Your sample
text here.
Your sample
text here.
TITLE
Your sample
text here.
Your sample
text here.
TITLE
Your sample
text here.
Your sample
text here.
TITLE
Your sample
text here.
Your sample
text here.
www.infoDiagram.com 2015www.infoDiagram.com 2015
75% 50% 25%
Your sample
text here
Your sample
text here
Your sample
text here
www.infoDiagram.com 2015www.infoDiagram.com 2015
70%
50%
90%
40%
Mobiles
Notebooks
Tablets
Station
www.infoDiagram.com 2015www.infoDiagram.com 2015
Your
sample
text here
Your
sample
text here
Your
sample
text here
Your
sample
text here
0% 10% 20% 30% 40% 50% 60% 70% 80% 90% 100%
60%
40%
70%
90%
www.infoDiagram.com 2015www.infoDiagram.com 2015
Your sample text here, Your sample text here, Your
sample text here
2000 employees (HR related data)
Your sample text here, Your sample text here, Your
sample text here
30% investment in R&D
Your sample text here, Your sample text here, Your
sample text here
300 certified people
Your sample text here, Your sample text here, Your
sample text here
50 satisfied clients
www.infoDiagram.com 2015www.infoDiagram.com 2015
123 clients…
12 patents
4 cloud apps
Explanation of what this value means
for your business.
Data measure description.
Explanation of what this value means
for your business.
Data measure description.
Explanation of what this value means
for your business.
Data measure description.
www.infoDiagram.com 2015www.infoDiagram.com 2015
Your sample
text
Your sample description here. Your
sample description here.
Your sample
text
Your sample description here. Your
sample description here.
Your sample
text
Your sample description here. Your
sample description here.
www.infoDiagram.com 2015www.infoDiagram.com 2015
www.infoDiagram.com 2015
Enrich your text slides
by using infographics diagrams
to make them stand out.
www.infoDiagram.com 2015
Your text Sample text
Enrich your text slides
by using infographics diagrams
to make them stand out.
www.infoDiagram.com 2015
Get our free infographics
diagrams at
www.infoDiagram.com
Your text Sample text
Enrich your text slides
by using infographics diagrams
to make them stand out.
www.infoDiagram.com 2015
Follow us on Slideshare for more presentations,
hit FOLLOW on slideshare.net/infodiagramFollow
Any question?
Contact us
www.infoDiagram.com
@infoDiagram
Get our free infographics
diagrams at
www.infoDiagram.com

Mais conteúdo relacionado

Mais procurados

Workshop digital transformation strategy digital road-map training
Workshop digital transformation strategy digital road-map trainingWorkshop digital transformation strategy digital road-map training
Workshop digital transformation strategy digital road-map trainingMiodrag Kostic, CMC
 
Creative Presentation Slides Design Making
Creative Presentation Slides Design Making Creative Presentation Slides Design Making
Creative Presentation Slides Design Making Peter Zvirinsky
 
The Presenter Manifesto : 8 Distinctions of a World Class Presenter by @eric_...
The Presenter Manifesto : 8 Distinctions of a World Class Presenter by @eric_...The Presenter Manifesto : 8 Distinctions of a World Class Presenter by @eric_...
The Presenter Manifesto : 8 Distinctions of a World Class Presenter by @eric_...HighSpark | Visual Storytelling Agency
 
A Framework for Digital Business Transformation
A Framework for Digital Business TransformationA Framework for Digital Business Transformation
A Framework for Digital Business TransformationCognizant
 
Power BI Admin Features & REST API
Power BI Admin Features & REST APIPower BI Admin Features & REST API
Power BI Admin Features & REST APIHARIHARAN R
 
The What If Technique presented by Motivate Design
The What If Technique presented by Motivate DesignThe What If Technique presented by Motivate Design
The What If Technique presented by Motivate DesignMotivate Design
 
25 Need-to-Know Marketing Stats
25 Need-to-Know Marketing Stats25 Need-to-Know Marketing Stats
25 Need-to-Know Marketing Statscontently
 
Microsoft Dynamics 365
Microsoft Dynamics 365Microsoft Dynamics 365
Microsoft Dynamics 365IOZ AG
 
Make Data Work for You
Make Data Work for YouMake Data Work for You
Make Data Work for YouDATAVERSITY
 
Microsoft power bi
Microsoft power biMicrosoft power bi
Microsoft power bitechpro360
 
DAS Slides: Building a Data Strategy — Practical Steps for Aligning with Busi...
DAS Slides: Building a Data Strategy — Practical Steps for Aligning with Busi...DAS Slides: Building a Data Strategy — Practical Steps for Aligning with Busi...
DAS Slides: Building a Data Strategy — Practical Steps for Aligning with Busi...DATAVERSITY
 
We’re Leaking, and Everything’s Fine: How and Why Companies Deliberately Leak...
We’re Leaking, and Everything’s Fine: How and Why Companies Deliberately Leak...We’re Leaking, and Everything’s Fine: How and Why Companies Deliberately Leak...
We’re Leaking, and Everything’s Fine: How and Why Companies Deliberately Leak...Ian McCarthy
 
Discover The Top 10 Types Of Colleagues Around You
Discover The Top 10 Types Of Colleagues Around YouDiscover The Top 10 Types Of Colleagues Around You
Discover The Top 10 Types Of Colleagues Around YouAnkur Tandon
 
Building Data-Centric Businesses
Building Data-Centric BusinessesBuilding Data-Centric Businesses
Building Data-Centric BusinessesThoughtworks
 
How to Use a Semantic Layer to Deliver Actionable Insights at Scale
How to Use a Semantic Layer to Deliver Actionable Insights at ScaleHow to Use a Semantic Layer to Deliver Actionable Insights at Scale
How to Use a Semantic Layer to Deliver Actionable Insights at ScaleDATAVERSITY
 
Qlik Sense for Beginners - www.techstuffy.com - QlikView Next Generation
Qlik Sense for Beginners - www.techstuffy.com - QlikView Next GenerationQlik Sense for Beginners - www.techstuffy.com - QlikView Next Generation
Qlik Sense for Beginners - www.techstuffy.com - QlikView Next GenerationPractical QlikView
 
Digital Transformation Templates.ppt
Digital Transformation Templates.pptDigital Transformation Templates.ppt
Digital Transformation Templates.pptOlusegun Mosugu
 

Mais procurados (20)

How to Use Photography for Great Presentations
How to Use Photography for Great PresentationsHow to Use Photography for Great Presentations
How to Use Photography for Great Presentations
 
Displaying Data
Displaying DataDisplaying Data
Displaying Data
 
Workshop digital transformation strategy digital road-map training
Workshop digital transformation strategy digital road-map trainingWorkshop digital transformation strategy digital road-map training
Workshop digital transformation strategy digital road-map training
 
Creative Presentation Slides Design Making
Creative Presentation Slides Design Making Creative Presentation Slides Design Making
Creative Presentation Slides Design Making
 
The Presenter Manifesto : 8 Distinctions of a World Class Presenter by @eric_...
The Presenter Manifesto : 8 Distinctions of a World Class Presenter by @eric_...The Presenter Manifesto : 8 Distinctions of a World Class Presenter by @eric_...
The Presenter Manifesto : 8 Distinctions of a World Class Presenter by @eric_...
 
A Framework for Digital Business Transformation
A Framework for Digital Business TransformationA Framework for Digital Business Transformation
A Framework for Digital Business Transformation
 
Power BI Admin Features & REST API
Power BI Admin Features & REST APIPower BI Admin Features & REST API
Power BI Admin Features & REST API
 
The What If Technique presented by Motivate Design
The What If Technique presented by Motivate DesignThe What If Technique presented by Motivate Design
The What If Technique presented by Motivate Design
 
Building a Digital Transformation Roadmap
Building a Digital Transformation RoadmapBuilding a Digital Transformation Roadmap
Building a Digital Transformation Roadmap
 
25 Need-to-Know Marketing Stats
25 Need-to-Know Marketing Stats25 Need-to-Know Marketing Stats
25 Need-to-Know Marketing Stats
 
Microsoft Dynamics 365
Microsoft Dynamics 365Microsoft Dynamics 365
Microsoft Dynamics 365
 
Make Data Work for You
Make Data Work for YouMake Data Work for You
Make Data Work for You
 
Microsoft power bi
Microsoft power biMicrosoft power bi
Microsoft power bi
 
DAS Slides: Building a Data Strategy — Practical Steps for Aligning with Busi...
DAS Slides: Building a Data Strategy — Practical Steps for Aligning with Busi...DAS Slides: Building a Data Strategy — Practical Steps for Aligning with Busi...
DAS Slides: Building a Data Strategy — Practical Steps for Aligning with Busi...
 
We’re Leaking, and Everything’s Fine: How and Why Companies Deliberately Leak...
We’re Leaking, and Everything’s Fine: How and Why Companies Deliberately Leak...We’re Leaking, and Everything’s Fine: How and Why Companies Deliberately Leak...
We’re Leaking, and Everything’s Fine: How and Why Companies Deliberately Leak...
 
Discover The Top 10 Types Of Colleagues Around You
Discover The Top 10 Types Of Colleagues Around YouDiscover The Top 10 Types Of Colleagues Around You
Discover The Top 10 Types Of Colleagues Around You
 
Building Data-Centric Businesses
Building Data-Centric BusinessesBuilding Data-Centric Businesses
Building Data-Centric Businesses
 
How to Use a Semantic Layer to Deliver Actionable Insights at Scale
How to Use a Semantic Layer to Deliver Actionable Insights at ScaleHow to Use a Semantic Layer to Deliver Actionable Insights at Scale
How to Use a Semantic Layer to Deliver Actionable Insights at Scale
 
Qlik Sense for Beginners - www.techstuffy.com - QlikView Next Generation
Qlik Sense for Beginners - www.techstuffy.com - QlikView Next GenerationQlik Sense for Beginners - www.techstuffy.com - QlikView Next Generation
Qlik Sense for Beginners - www.techstuffy.com - QlikView Next Generation
 
Digital Transformation Templates.ppt
Digital Transformation Templates.pptDigital Transformation Templates.ppt
Digital Transformation Templates.ppt
 

Destaque

List of countries and capitals with currency and language wikipedia, the fr...
List of countries and capitals with currency and language   wikipedia, the fr...List of countries and capitals with currency and language   wikipedia, the fr...
List of countries and capitals with currency and language wikipedia, the fr...ramuji38
 
Presentation Skills Public Speaking training visuals toolbox
Presentation Skills Public Speaking training visuals toolboxPresentation Skills Public Speaking training visuals toolbox
Presentation Skills Public Speaking training visuals toolboxPeter Zvirinsky
 
Healthcare medical & pharma visuals presentation toolbox
Healthcare medical & pharma visuals presentation toolboxHealthcare medical & pharma visuals presentation toolbox
Healthcare medical & pharma visuals presentation toolboxPeter Zvirinsky
 
Diagram Mistakes in Presentation Slide Design
Diagram Mistakes in Presentation Slide DesignDiagram Mistakes in Presentation Slide Design
Diagram Mistakes in Presentation Slide DesignPeter Zvirinsky
 
Uncertainty in IT project - SCRUM rules
Uncertainty in IT project - SCRUM rulesUncertainty in IT project - SCRUM rules
Uncertainty in IT project - SCRUM rulesPeter Zvirinsky
 
Sustainable Transport and Green Fuel Types
Sustainable Transport and Green Fuel TypesSustainable Transport and Green Fuel Types
Sustainable Transport and Green Fuel TypesPeter Zvirinsky
 

Destaque (6)

List of countries and capitals with currency and language wikipedia, the fr...
List of countries and capitals with currency and language   wikipedia, the fr...List of countries and capitals with currency and language   wikipedia, the fr...
List of countries and capitals with currency and language wikipedia, the fr...
 
Presentation Skills Public Speaking training visuals toolbox
Presentation Skills Public Speaking training visuals toolboxPresentation Skills Public Speaking training visuals toolbox
Presentation Skills Public Speaking training visuals toolbox
 
Healthcare medical & pharma visuals presentation toolbox
Healthcare medical & pharma visuals presentation toolboxHealthcare medical & pharma visuals presentation toolbox
Healthcare medical & pharma visuals presentation toolbox
 
Diagram Mistakes in Presentation Slide Design
Diagram Mistakes in Presentation Slide DesignDiagram Mistakes in Presentation Slide Design
Diagram Mistakes in Presentation Slide Design
 
Uncertainty in IT project - SCRUM rules
Uncertainty in IT project - SCRUM rulesUncertainty in IT project - SCRUM rules
Uncertainty in IT project - SCRUM rules
 
Sustainable Transport and Green Fuel Types
Sustainable Transport and Green Fuel TypesSustainable Transport and Green Fuel Types
Sustainable Transport and Green Fuel Types
 

Semelhante a Infographics Key Data KPI presentation slides

Corporate Alignment PowerPoint Presentation Slides
Corporate Alignment PowerPoint Presentation Slides Corporate Alignment PowerPoint Presentation Slides
Corporate Alignment PowerPoint Presentation Slides SlideTeam
 
Business Alignment PowerPoint Presentation Slides
Business Alignment PowerPoint Presentation Slides Business Alignment PowerPoint Presentation Slides
Business Alignment PowerPoint Presentation Slides SlideTeam
 
Candidate Mapping PowerPoint Presentation Slides
Candidate Mapping PowerPoint Presentation Slides Candidate Mapping PowerPoint Presentation Slides
Candidate Mapping PowerPoint Presentation Slides SlideTeam
 
360 Degree View Of Customer Powerpoint Presentation Slides
360 Degree View Of Customer Powerpoint Presentation Slides360 Degree View Of Customer Powerpoint Presentation Slides
360 Degree View Of Customer Powerpoint Presentation SlidesSlideTeam
 
Workplace Digital Transformation PowerPoint Presentation Slides
Workplace Digital Transformation PowerPoint Presentation Slides Workplace Digital Transformation PowerPoint Presentation Slides
Workplace Digital Transformation PowerPoint Presentation Slides SlideTeam
 
Digital Innovation Strategy PowerPoint Presentation Slides
Digital Innovation Strategy PowerPoint Presentation Slides Digital Innovation Strategy PowerPoint Presentation Slides
Digital Innovation Strategy PowerPoint Presentation Slides SlideTeam
 
New Product Launch Plan PowerPoint Presentation Slides
New Product Launch Plan PowerPoint Presentation SlidesNew Product Launch Plan PowerPoint Presentation Slides
New Product Launch Plan PowerPoint Presentation SlidesSlideTeam
 
New Product Launch Plan Powerpoint Presentation Slides
New Product Launch Plan Powerpoint Presentation SlidesNew Product Launch Plan Powerpoint Presentation Slides
New Product Launch Plan Powerpoint Presentation SlidesSlideTeam
 
Digital Innovation Strategy PowerPoint Presentation Slides
Digital Innovation Strategy PowerPoint Presentation SlidesDigital Innovation Strategy PowerPoint Presentation Slides
Digital Innovation Strategy PowerPoint Presentation SlidesSlideTeam
 
Mattermark 1st Series A Deck
Mattermark 1st Series A DeckMattermark 1st Series A Deck
Mattermark 1st Series A DeckDanielle Morrill
 
Peoplewave pitch presentation - June 2017
Peoplewave pitch presentation - June 2017Peoplewave pitch presentation - June 2017
Peoplewave pitch presentation - June 2017Damien Cummings
 
Analyzing Customer Journey And Data From 360 Degree PowerPoint Presentation S...
Analyzing Customer Journey And Data From 360 Degree PowerPoint Presentation S...Analyzing Customer Journey And Data From 360 Degree PowerPoint Presentation S...
Analyzing Customer Journey And Data From 360 Degree PowerPoint Presentation S...SlideTeam
 
Customer Experience: A Catalyst for Digital Transformation
Customer Experience: A Catalyst for Digital TransformationCustomer Experience: A Catalyst for Digital Transformation
Customer Experience: A Catalyst for Digital TransformationCloudera, Inc.
 
Customer Success 2020
Customer Success 2020Customer Success 2020
Customer Success 2020Underscore VC
 
BIG Data & Hadoop Applications in E-Commerce
BIG Data & Hadoop Applications in E-CommerceBIG Data & Hadoop Applications in E-Commerce
BIG Data & Hadoop Applications in E-CommerceSkillspeed
 
Customer Relationship Management Model PowerPoint Presentation Slides
Customer Relationship Management Model PowerPoint Presentation SlidesCustomer Relationship Management Model PowerPoint Presentation Slides
Customer Relationship Management Model PowerPoint Presentation SlidesSlideTeam
 
B2b Demand Generation PowerPoint Presentation Slides
B2b Demand Generation PowerPoint Presentation Slides B2b Demand Generation PowerPoint Presentation Slides
B2b Demand Generation PowerPoint Presentation Slides SlideTeam
 
How Artificial Intelligence is Applied to Drive Trade Effectiveness
How Artificial Intelligence is Applied to Drive Trade EffectivenessHow Artificial Intelligence is Applied to Drive Trade Effectiveness
How Artificial Intelligence is Applied to Drive Trade Effectivenessvisualfabriq Revenue Management
 
Value Chain Analysis Framework PowerPoint Presentation Slides
Value Chain Analysis Framework PowerPoint Presentation Slides Value Chain Analysis Framework PowerPoint Presentation Slides
Value Chain Analysis Framework PowerPoint Presentation Slides SlideTeam
 

Semelhante a Infographics Key Data KPI presentation slides (20)

Corporate Alignment PowerPoint Presentation Slides
Corporate Alignment PowerPoint Presentation Slides Corporate Alignment PowerPoint Presentation Slides
Corporate Alignment PowerPoint Presentation Slides
 
Business Alignment PowerPoint Presentation Slides
Business Alignment PowerPoint Presentation Slides Business Alignment PowerPoint Presentation Slides
Business Alignment PowerPoint Presentation Slides
 
Candidate Mapping PowerPoint Presentation Slides
Candidate Mapping PowerPoint Presentation Slides Candidate Mapping PowerPoint Presentation Slides
Candidate Mapping PowerPoint Presentation Slides
 
360 Degree View Of Customer Powerpoint Presentation Slides
360 Degree View Of Customer Powerpoint Presentation Slides360 Degree View Of Customer Powerpoint Presentation Slides
360 Degree View Of Customer Powerpoint Presentation Slides
 
Workplace Digital Transformation PowerPoint Presentation Slides
Workplace Digital Transformation PowerPoint Presentation Slides Workplace Digital Transformation PowerPoint Presentation Slides
Workplace Digital Transformation PowerPoint Presentation Slides
 
Digital Innovation Strategy PowerPoint Presentation Slides
Digital Innovation Strategy PowerPoint Presentation Slides Digital Innovation Strategy PowerPoint Presentation Slides
Digital Innovation Strategy PowerPoint Presentation Slides
 
New Product Launch Plan PowerPoint Presentation Slides
New Product Launch Plan PowerPoint Presentation SlidesNew Product Launch Plan PowerPoint Presentation Slides
New Product Launch Plan PowerPoint Presentation Slides
 
New Product Launch Plan Powerpoint Presentation Slides
New Product Launch Plan Powerpoint Presentation SlidesNew Product Launch Plan Powerpoint Presentation Slides
New Product Launch Plan Powerpoint Presentation Slides
 
Digital Innovation Strategy PowerPoint Presentation Slides
Digital Innovation Strategy PowerPoint Presentation SlidesDigital Innovation Strategy PowerPoint Presentation Slides
Digital Innovation Strategy PowerPoint Presentation Slides
 
Mattermark 1st Series A Deck
Mattermark 1st Series A DeckMattermark 1st Series A Deck
Mattermark 1st Series A Deck
 
Peoplewave pitch presentation - June 2017
Peoplewave pitch presentation - June 2017Peoplewave pitch presentation - June 2017
Peoplewave pitch presentation - June 2017
 
Analyzing Customer Journey And Data From 360 Degree PowerPoint Presentation S...
Analyzing Customer Journey And Data From 360 Degree PowerPoint Presentation S...Analyzing Customer Journey And Data From 360 Degree PowerPoint Presentation S...
Analyzing Customer Journey And Data From 360 Degree PowerPoint Presentation S...
 
Customer Experience: A Catalyst for Digital Transformation
Customer Experience: A Catalyst for Digital TransformationCustomer Experience: A Catalyst for Digital Transformation
Customer Experience: A Catalyst for Digital Transformation
 
Customer Success 2020
Customer Success 2020Customer Success 2020
Customer Success 2020
 
BIG Data & Hadoop Applications in E-Commerce
BIG Data & Hadoop Applications in E-CommerceBIG Data & Hadoop Applications in E-Commerce
BIG Data & Hadoop Applications in E-Commerce
 
Customer Relationship Management Model PowerPoint Presentation Slides
Customer Relationship Management Model PowerPoint Presentation SlidesCustomer Relationship Management Model PowerPoint Presentation Slides
Customer Relationship Management Model PowerPoint Presentation Slides
 
Spike - pitch deck
Spike - pitch deckSpike - pitch deck
Spike - pitch deck
 
B2b Demand Generation PowerPoint Presentation Slides
B2b Demand Generation PowerPoint Presentation Slides B2b Demand Generation PowerPoint Presentation Slides
B2b Demand Generation PowerPoint Presentation Slides
 
How Artificial Intelligence is Applied to Drive Trade Effectiveness
How Artificial Intelligence is Applied to Drive Trade EffectivenessHow Artificial Intelligence is Applied to Drive Trade Effectiveness
How Artificial Intelligence is Applied to Drive Trade Effectiveness
 
Value Chain Analysis Framework PowerPoint Presentation Slides
Value Chain Analysis Framework PowerPoint Presentation Slides Value Chain Analysis Framework PowerPoint Presentation Slides
Value Chain Analysis Framework PowerPoint Presentation Slides
 

Mais de Peter Zvirinsky

Coronavirus Protection and Actions: Creative Illustration in PowerPoint
Coronavirus Protection and Actions: Creative Illustration  in PowerPointCoronavirus Protection and Actions: Creative Illustration  in PowerPoint
Coronavirus Protection and Actions: Creative Illustration in PowerPointPeter Zvirinsky
 
Finance and Sales Charts in PowerPoint: Communicate through Symbols
Finance and Sales Charts in PowerPoint: Communicate through SymbolsFinance and Sales Charts in PowerPoint: Communicate through Symbols
Finance and Sales Charts in PowerPoint: Communicate through SymbolsPeter Zvirinsky
 
How to Design Project Calendar in 4 Steps
How to Design Project Calendar in 4 StepsHow to Design Project Calendar in 4 Steps
How to Design Project Calendar in 4 StepsPeter Zvirinsky
 
Create Happy Holidays card in 5 minutes using PowerPoint
Create Happy Holidays card in 5 minutes using PowerPointCreate Happy Holidays card in 5 minutes using PowerPoint
Create Happy Holidays card in 5 minutes using PowerPointPeter Zvirinsky
 
How to Create Diagrams instead of Text
How to Create Diagrams instead of TextHow to Create Diagrams instead of Text
How to Create Diagrams instead of TextPeter Zvirinsky
 
Illustrating Top-Management Concepts in Your Presentation
Illustrating Top-Management Concepts in Your PresentationIllustrating Top-Management Concepts in Your Presentation
Illustrating Top-Management Concepts in Your PresentationPeter Zvirinsky
 
Making attractive Big Data Diagrams
Making attractive Big Data DiagramsMaking attractive Big Data Diagrams
Making attractive Big Data DiagramsPeter Zvirinsky
 
Presentation Rooms - Training Toolbox, part 2
Presentation Rooms - Training Toolbox, part 2Presentation Rooms - Training Toolbox, part 2
Presentation Rooms - Training Toolbox, part 2Peter Zvirinsky
 
Waste Sources Treatment Ecology Presentation Visuals
Waste Sources Treatment Ecology Presentation VisualsWaste Sources Treatment Ecology Presentation Visuals
Waste Sources Treatment Ecology Presentation VisualsPeter Zvirinsky
 
Hand Drawn Pencil Symbols Banners Visuals ppt
Hand Drawn Pencil Symbols Banners Visuals pptHand Drawn Pencil Symbols Banners Visuals ppt
Hand Drawn Pencil Symbols Banners Visuals pptPeter Zvirinsky
 
BPO Transition Framework visuals toolbox PPT
BPO Transition Framework visuals toolbox PPTBPO Transition Framework visuals toolbox PPT
BPO Transition Framework visuals toolbox PPTPeter Zvirinsky
 
Infographics Shapes TimeLines PPT Flow Diagrams - infodiagram part2
Infographics Shapes TimeLines PPT Flow Diagrams - infodiagram part2Infographics Shapes TimeLines PPT Flow Diagrams - infodiagram part2
Infographics Shapes TimeLines PPT Flow Diagrams - infodiagram part2Peter Zvirinsky
 
Infographics Text Lists Powerpoint diagrams
Infographics Text Lists Powerpoint diagramsInfographics Text Lists Powerpoint diagrams
Infographics Text Lists Powerpoint diagramsPeter Zvirinsky
 
Fireworks Injuries Infographics
Fireworks Injuries InfographicsFireworks Injuries Infographics
Fireworks Injuries InfographicsPeter Zvirinsky
 
Feedback training visuals toolbox presentation
Feedback training visuals toolbox presentationFeedback training visuals toolbox presentation
Feedback training visuals toolbox presentationPeter Zvirinsky
 
Housing Logistics Visuals PPT InfoDiagram
Housing Logistics Visuals PPT InfoDiagramHousing Logistics Visuals PPT InfoDiagram
Housing Logistics Visuals PPT InfoDiagramPeter Zvirinsky
 
How to Illustrate Energy Resources Presentation
How to Illustrate Energy Resources PresentationHow to Illustrate Energy Resources Presentation
How to Illustrate Energy Resources PresentationPeter Zvirinsky
 
Trends in slide design - beyond flat style?
Trends in slide design - beyond flat style?Trends in slide design - beyond flat style?
Trends in slide design - beyond flat style?Peter Zvirinsky
 
How to Make Christmas Card in 5 minutes using PowerPoint
How to Make Christmas Card in 5 minutes using PowerPointHow to Make Christmas Card in 5 minutes using PowerPoint
How to Make Christmas Card in 5 minutes using PowerPointPeter Zvirinsky
 
How to Change Text to Diagrams (infodiagram visualization)
How to Change Text to Diagrams (infodiagram visualization)How to Change Text to Diagrams (infodiagram visualization)
How to Change Text to Diagrams (infodiagram visualization)Peter Zvirinsky
 

Mais de Peter Zvirinsky (20)

Coronavirus Protection and Actions: Creative Illustration in PowerPoint
Coronavirus Protection and Actions: Creative Illustration  in PowerPointCoronavirus Protection and Actions: Creative Illustration  in PowerPoint
Coronavirus Protection and Actions: Creative Illustration in PowerPoint
 
Finance and Sales Charts in PowerPoint: Communicate through Symbols
Finance and Sales Charts in PowerPoint: Communicate through SymbolsFinance and Sales Charts in PowerPoint: Communicate through Symbols
Finance and Sales Charts in PowerPoint: Communicate through Symbols
 
How to Design Project Calendar in 4 Steps
How to Design Project Calendar in 4 StepsHow to Design Project Calendar in 4 Steps
How to Design Project Calendar in 4 Steps
 
Create Happy Holidays card in 5 minutes using PowerPoint
Create Happy Holidays card in 5 minutes using PowerPointCreate Happy Holidays card in 5 minutes using PowerPoint
Create Happy Holidays card in 5 minutes using PowerPoint
 
How to Create Diagrams instead of Text
How to Create Diagrams instead of TextHow to Create Diagrams instead of Text
How to Create Diagrams instead of Text
 
Illustrating Top-Management Concepts in Your Presentation
Illustrating Top-Management Concepts in Your PresentationIllustrating Top-Management Concepts in Your Presentation
Illustrating Top-Management Concepts in Your Presentation
 
Making attractive Big Data Diagrams
Making attractive Big Data DiagramsMaking attractive Big Data Diagrams
Making attractive Big Data Diagrams
 
Presentation Rooms - Training Toolbox, part 2
Presentation Rooms - Training Toolbox, part 2Presentation Rooms - Training Toolbox, part 2
Presentation Rooms - Training Toolbox, part 2
 
Waste Sources Treatment Ecology Presentation Visuals
Waste Sources Treatment Ecology Presentation VisualsWaste Sources Treatment Ecology Presentation Visuals
Waste Sources Treatment Ecology Presentation Visuals
 
Hand Drawn Pencil Symbols Banners Visuals ppt
Hand Drawn Pencil Symbols Banners Visuals pptHand Drawn Pencil Symbols Banners Visuals ppt
Hand Drawn Pencil Symbols Banners Visuals ppt
 
BPO Transition Framework visuals toolbox PPT
BPO Transition Framework visuals toolbox PPTBPO Transition Framework visuals toolbox PPT
BPO Transition Framework visuals toolbox PPT
 
Infographics Shapes TimeLines PPT Flow Diagrams - infodiagram part2
Infographics Shapes TimeLines PPT Flow Diagrams - infodiagram part2Infographics Shapes TimeLines PPT Flow Diagrams - infodiagram part2
Infographics Shapes TimeLines PPT Flow Diagrams - infodiagram part2
 
Infographics Text Lists Powerpoint diagrams
Infographics Text Lists Powerpoint diagramsInfographics Text Lists Powerpoint diagrams
Infographics Text Lists Powerpoint diagrams
 
Fireworks Injuries Infographics
Fireworks Injuries InfographicsFireworks Injuries Infographics
Fireworks Injuries Infographics
 
Feedback training visuals toolbox presentation
Feedback training visuals toolbox presentationFeedback training visuals toolbox presentation
Feedback training visuals toolbox presentation
 
Housing Logistics Visuals PPT InfoDiagram
Housing Logistics Visuals PPT InfoDiagramHousing Logistics Visuals PPT InfoDiagram
Housing Logistics Visuals PPT InfoDiagram
 
How to Illustrate Energy Resources Presentation
How to Illustrate Energy Resources PresentationHow to Illustrate Energy Resources Presentation
How to Illustrate Energy Resources Presentation
 
Trends in slide design - beyond flat style?
Trends in slide design - beyond flat style?Trends in slide design - beyond flat style?
Trends in slide design - beyond flat style?
 
How to Make Christmas Card in 5 minutes using PowerPoint
How to Make Christmas Card in 5 minutes using PowerPointHow to Make Christmas Card in 5 minutes using PowerPoint
How to Make Christmas Card in 5 minutes using PowerPoint
 
How to Change Text to Diagrams (infodiagram visualization)
How to Change Text to Diagrams (infodiagram visualization)How to Change Text to Diagrams (infodiagram visualization)
How to Change Text to Diagrams (infodiagram visualization)
 

Último

Networking Case Study prepared by teacher.pptx
Networking Case Study prepared by teacher.pptxNetworking Case Study prepared by teacher.pptx
Networking Case Study prepared by teacher.pptxHimangsuNath
 
modul pembelajaran robotic Workshop _ by Slidesgo.pptx
modul pembelajaran robotic Workshop _ by Slidesgo.pptxmodul pembelajaran robotic Workshop _ by Slidesgo.pptx
modul pembelajaran robotic Workshop _ by Slidesgo.pptxaleedritatuxx
 
FAIR, FAIRsharing, FAIR Cookbook and ELIXIR - Sansone SA - Boston 2024
FAIR, FAIRsharing, FAIR Cookbook and ELIXIR - Sansone SA - Boston 2024FAIR, FAIRsharing, FAIR Cookbook and ELIXIR - Sansone SA - Boston 2024
FAIR, FAIRsharing, FAIR Cookbook and ELIXIR - Sansone SA - Boston 2024Susanna-Assunta Sansone
 
Semantic Shed - Squashing and Squeezing.pptx
Semantic Shed - Squashing and Squeezing.pptxSemantic Shed - Squashing and Squeezing.pptx
Semantic Shed - Squashing and Squeezing.pptxMike Bennett
 
What To Do For World Nature Conservation Day by Slidesgo.pptx
What To Do For World Nature Conservation Day by Slidesgo.pptxWhat To Do For World Nature Conservation Day by Slidesgo.pptx
What To Do For World Nature Conservation Day by Slidesgo.pptxSimranPal17
 
Predictive Analysis for Loan Default Presentation : Data Analysis Project PPT
Predictive Analysis for Loan Default  Presentation : Data Analysis Project PPTPredictive Analysis for Loan Default  Presentation : Data Analysis Project PPT
Predictive Analysis for Loan Default Presentation : Data Analysis Project PPTBoston Institute of Analytics
 
Defining Constituents, Data Vizzes and Telling a Data Story
Defining Constituents, Data Vizzes and Telling a Data StoryDefining Constituents, Data Vizzes and Telling a Data Story
Defining Constituents, Data Vizzes and Telling a Data StoryJeremy Anderson
 
Principles and Practices of Data Visualization
Principles and Practices of Data VisualizationPrinciples and Practices of Data Visualization
Principles and Practices of Data VisualizationKianJazayeri1
 
Data Factory in Microsoft Fabric (MsBIP #82)
Data Factory in Microsoft Fabric (MsBIP #82)Data Factory in Microsoft Fabric (MsBIP #82)
Data Factory in Microsoft Fabric (MsBIP #82)Cathrine Wilhelmsen
 
NO1 Certified Black Magic Specialist Expert Amil baba in Lahore Islamabad Raw...
NO1 Certified Black Magic Specialist Expert Amil baba in Lahore Islamabad Raw...NO1 Certified Black Magic Specialist Expert Amil baba in Lahore Islamabad Raw...
NO1 Certified Black Magic Specialist Expert Amil baba in Lahore Islamabad Raw...Amil Baba Dawood bangali
 
INTRODUCTION TO Natural language processing
INTRODUCTION TO Natural language processingINTRODUCTION TO Natural language processing
INTRODUCTION TO Natural language processingsocarem879
 
Decoding the Heart: Student Presentation on Heart Attack Prediction with Data...
Decoding the Heart: Student Presentation on Heart Attack Prediction with Data...Decoding the Heart: Student Presentation on Heart Attack Prediction with Data...
Decoding the Heart: Student Presentation on Heart Attack Prediction with Data...Boston Institute of Analytics
 
The Power of Data-Driven Storytelling_ Unveiling the Layers of Insight.pptx
The Power of Data-Driven Storytelling_ Unveiling the Layers of Insight.pptxThe Power of Data-Driven Storytelling_ Unveiling the Layers of Insight.pptx
The Power of Data-Driven Storytelling_ Unveiling the Layers of Insight.pptxTasha Penwell
 
Unveiling the Role of Social Media Suspect Investigators in Preventing Online...
Unveiling the Role of Social Media Suspect Investigators in Preventing Online...Unveiling the Role of Social Media Suspect Investigators in Preventing Online...
Unveiling the Role of Social Media Suspect Investigators in Preventing Online...Milind Agarwal
 
Decoding Patterns: Customer Churn Prediction Data Analysis Project
Decoding Patterns: Customer Churn Prediction Data Analysis ProjectDecoding Patterns: Customer Churn Prediction Data Analysis Project
Decoding Patterns: Customer Churn Prediction Data Analysis ProjectBoston Institute of Analytics
 
Conf42-LLM_Adding Generative AI to Real-Time Streaming Pipelines
Conf42-LLM_Adding Generative AI to Real-Time Streaming PipelinesConf42-LLM_Adding Generative AI to Real-Time Streaming Pipelines
Conf42-LLM_Adding Generative AI to Real-Time Streaming PipelinesTimothy Spann
 
Student Profile Sample report on improving academic performance by uniting gr...
Student Profile Sample report on improving academic performance by uniting gr...Student Profile Sample report on improving academic performance by uniting gr...
Student Profile Sample report on improving academic performance by uniting gr...Seán Kennedy
 
Cyber awareness ppt on the recorded data
Cyber awareness ppt on the recorded dataCyber awareness ppt on the recorded data
Cyber awareness ppt on the recorded dataTecnoIncentive
 
convolutional neural network and its applications.pdf
convolutional neural network and its applications.pdfconvolutional neural network and its applications.pdf
convolutional neural network and its applications.pdfSubhamKumar3239
 
Bank Loan Approval Analysis: A Comprehensive Data Analysis Project
Bank Loan Approval Analysis: A Comprehensive Data Analysis ProjectBank Loan Approval Analysis: A Comprehensive Data Analysis Project
Bank Loan Approval Analysis: A Comprehensive Data Analysis ProjectBoston Institute of Analytics
 

Último (20)

Networking Case Study prepared by teacher.pptx
Networking Case Study prepared by teacher.pptxNetworking Case Study prepared by teacher.pptx
Networking Case Study prepared by teacher.pptx
 
modul pembelajaran robotic Workshop _ by Slidesgo.pptx
modul pembelajaran robotic Workshop _ by Slidesgo.pptxmodul pembelajaran robotic Workshop _ by Slidesgo.pptx
modul pembelajaran robotic Workshop _ by Slidesgo.pptx
 
FAIR, FAIRsharing, FAIR Cookbook and ELIXIR - Sansone SA - Boston 2024
FAIR, FAIRsharing, FAIR Cookbook and ELIXIR - Sansone SA - Boston 2024FAIR, FAIRsharing, FAIR Cookbook and ELIXIR - Sansone SA - Boston 2024
FAIR, FAIRsharing, FAIR Cookbook and ELIXIR - Sansone SA - Boston 2024
 
Semantic Shed - Squashing and Squeezing.pptx
Semantic Shed - Squashing and Squeezing.pptxSemantic Shed - Squashing and Squeezing.pptx
Semantic Shed - Squashing and Squeezing.pptx
 
What To Do For World Nature Conservation Day by Slidesgo.pptx
What To Do For World Nature Conservation Day by Slidesgo.pptxWhat To Do For World Nature Conservation Day by Slidesgo.pptx
What To Do For World Nature Conservation Day by Slidesgo.pptx
 
Predictive Analysis for Loan Default Presentation : Data Analysis Project PPT
Predictive Analysis for Loan Default  Presentation : Data Analysis Project PPTPredictive Analysis for Loan Default  Presentation : Data Analysis Project PPT
Predictive Analysis for Loan Default Presentation : Data Analysis Project PPT
 
Defining Constituents, Data Vizzes and Telling a Data Story
Defining Constituents, Data Vizzes and Telling a Data StoryDefining Constituents, Data Vizzes and Telling a Data Story
Defining Constituents, Data Vizzes and Telling a Data Story
 
Principles and Practices of Data Visualization
Principles and Practices of Data VisualizationPrinciples and Practices of Data Visualization
Principles and Practices of Data Visualization
 
Data Factory in Microsoft Fabric (MsBIP #82)
Data Factory in Microsoft Fabric (MsBIP #82)Data Factory in Microsoft Fabric (MsBIP #82)
Data Factory in Microsoft Fabric (MsBIP #82)
 
NO1 Certified Black Magic Specialist Expert Amil baba in Lahore Islamabad Raw...
NO1 Certified Black Magic Specialist Expert Amil baba in Lahore Islamabad Raw...NO1 Certified Black Magic Specialist Expert Amil baba in Lahore Islamabad Raw...
NO1 Certified Black Magic Specialist Expert Amil baba in Lahore Islamabad Raw...
 
INTRODUCTION TO Natural language processing
INTRODUCTION TO Natural language processingINTRODUCTION TO Natural language processing
INTRODUCTION TO Natural language processing
 
Decoding the Heart: Student Presentation on Heart Attack Prediction with Data...
Decoding the Heart: Student Presentation on Heart Attack Prediction with Data...Decoding the Heart: Student Presentation on Heart Attack Prediction with Data...
Decoding the Heart: Student Presentation on Heart Attack Prediction with Data...
 
The Power of Data-Driven Storytelling_ Unveiling the Layers of Insight.pptx
The Power of Data-Driven Storytelling_ Unveiling the Layers of Insight.pptxThe Power of Data-Driven Storytelling_ Unveiling the Layers of Insight.pptx
The Power of Data-Driven Storytelling_ Unveiling the Layers of Insight.pptx
 
Unveiling the Role of Social Media Suspect Investigators in Preventing Online...
Unveiling the Role of Social Media Suspect Investigators in Preventing Online...Unveiling the Role of Social Media Suspect Investigators in Preventing Online...
Unveiling the Role of Social Media Suspect Investigators in Preventing Online...
 
Decoding Patterns: Customer Churn Prediction Data Analysis Project
Decoding Patterns: Customer Churn Prediction Data Analysis ProjectDecoding Patterns: Customer Churn Prediction Data Analysis Project
Decoding Patterns: Customer Churn Prediction Data Analysis Project
 
Conf42-LLM_Adding Generative AI to Real-Time Streaming Pipelines
Conf42-LLM_Adding Generative AI to Real-Time Streaming PipelinesConf42-LLM_Adding Generative AI to Real-Time Streaming Pipelines
Conf42-LLM_Adding Generative AI to Real-Time Streaming Pipelines
 
Student Profile Sample report on improving academic performance by uniting gr...
Student Profile Sample report on improving academic performance by uniting gr...Student Profile Sample report on improving academic performance by uniting gr...
Student Profile Sample report on improving academic performance by uniting gr...
 
Cyber awareness ppt on the recorded data
Cyber awareness ppt on the recorded dataCyber awareness ppt on the recorded data
Cyber awareness ppt on the recorded data
 
convolutional neural network and its applications.pdf
convolutional neural network and its applications.pdfconvolutional neural network and its applications.pdf
convolutional neural network and its applications.pdf
 
Bank Loan Approval Analysis: A Comprehensive Data Analysis Project
Bank Loan Approval Analysis: A Comprehensive Data Analysis ProjectBank Loan Approval Analysis: A Comprehensive Data Analysis Project
Bank Loan Approval Analysis: A Comprehensive Data Analysis Project
 

Infographics Key Data KPI presentation slides