SlideShare uma empresa Scribd logo
1 de 22
HOTEL JARDIN
  March 2007
Confidentiality Agreement

The undersigned reader acknowledges that the information provided by _______________ in this business plan is
confidential; therefore, reader agrees not to disclose it without the express written permission of
_______________.

It is acknowledged by reader that information to be furnished in this business plan is in all respects confidential in
nature, other than information which is in the public domain through other means and that any disclosure or use of
same by reader, may cause serious harm or damage to _______________.

Upon request, this document is to be immediately returned to _______________.

___________________
Signature

___________________
Name (typed or printed)

___________________
Date

This is a business plan. It does not imply an offering of securities.
Table of Contents

1.0   Executive Summary . . . . . . . . . . . . . . . . . . . . . . . . . . . . . . . . . . . . . . . . . . . . . . . . . . . . . . . . . . . . . . . . . . . . . . 1
      1.1     Objectives . . . . . . . . . . . . . . . . . . . . . . . . . . . . . . . . . . . . . . . . . . . . . . . . . . . . . . . . . . . . . . . . . . . . . . . 1
      1.2     Mission . . . . . . . . . . . . . . . . . . . . . . . . . . . . . . . . . . . . . . . . . . . . . . . . . . . . . . . . . . . . . . . . . . . . . . . . . 1
      1.3     Keys to Success . . . . . . . . . . . . . . . . . . . . . . . . . . . . . . . . . . . . . . . . . . . . . . . . . . . . . . . . . . . . . . . . . . . 2

2.0   Company Summary . . . . . . . . . . . . . . . . . . . . . . . . . . . . . . . . . . . . . . . . . . . . . . . . . . . . . . . . . . . . . . . . . . . . . . 2
      2.1   Company Ownership . . . . . . . . . . . . . . . . . . . . . . . . . . . . . . . . . . . . . . . . . . . . . . . . . . . . . . . . . . . . . . 2
      2.2   Start-up Summary . . . . . . . . . . . . . . . . . . . . . . . . . . . . . . . . . . . . . . . . . . . . . . . . . . . . . . . . . . . . . . . . . 2

3.0   Services . . . . . . . . . . . . . . . . . . . . . . . . . . . . . . . . . . . . . . . . . . . . . . . . . . . . . . . . . . . . . . . . . . . . . . . . . . . . . . . . 4

4.0   Market Analysis Summary . . . . . . . . . . . . . . . . . . . . . . . . . . . . . . . . . . . . . . . . . . . . . . . . . . . . . . . . . . . . . . . . 4
      4.1    Market Segmentation . . . . . . . . . . . . . . . . . . . . . . . . . . . . . . . . . . . . . . . . . . . . . . . . . . . . . . . . . . . . . . 4

5.0   Strategy and Implementation Summary . . . . . . . . . . . . . . . . . . . . . . . . . . . . . . . . . . . . . . . . . . . . . . . . . . . .                             5
      5.1     Competitive Edge . . . . . . . . . . . . . . . . . . . . . . . . . . . . . . . . . . . . . . . . . . . . . . . . . . . . . . . . . . . . . . . . .              5
      5.2     Marketing Strategy . . . . . . . . . . . . . . . . . . . . . . . . . . . . . . . . . . . . . . . . . . . . . . . . . . . . . . . . . . . . . . . .              5
      5.3     Sales Strategy . . . . . . . . . . . . . . . . . . . . . . . . . . . . . . . . . . . . . . . . . . . . . . . . . . . . . . . . . . . . . . . . . . . .          5
              5.3.1    Sales Forecast . . . . . . . . . . . . . . . . . . . . . . . . . . . . . . . . . . . . . . . . . . . . . . . . . . . . . . . . . . . . .               5

6.0   Management Summary . . . . . . . . . . . . . . . . . . . . . . . . . . . . . . . . . . . . . . . . . . . . . . . . . . . . . . . . . . . . . . . . . . . 7
      6.1   Personnel Plan . . . . . . . . . . . . . . . . . . . . . . . . . . . . . . . . . . . . . . . . . . . . . . . . . . . . . . . . . . . . . . . . . . . 7

7.0   Financial Plan . . . . . . . . . . . . . . . . . . . . . . . . . . . . . . . . . . . . . . . . . . . . . . . . . . . . . . . . . . . . . . . . . . . . . . . . . .      7
      7.1     Important Assumptions . . . . . . . . . . . . . . . . . . . . . . . . . . . . . . . . . . . . . . . . . . . . . . . . . . . . . . . . . . . .                   8
      7.2     Break-even Analysis . . . . . . . . . . . . . . . . . . . . . . . . . . . . . . . . . . . . . . . . . . . . . . . . . . . . . . . . . . . . . . .               8
      7.3     Projected Profit and Loss . . . . . . . . . . . . . . . . . . . . . . . . . . . . . . . . . . . . . . . . . . . . . . . . . . . . . . . . . . .                 8
      7.4     Projected Cash Flow . . . . . . . . . . . . . . . . . . . . . . . . . . . . . . . . . . . . . . . . . . . . . . . . . . . . . . . . . . . . . . .               11
      7.5     Projected Balance Sheet . . . . . . . . . . . . . . . . . . . . . . . . . . . . . . . . . . . . . . . . . . . . . . . . . . . . . . . . . . . .                 12
Hotel Jardin

1.0 Executive Summary

      Introduction

      The Long-goal of Hotel Jardin is to become one of the best choices on Santiago, Dominican
      Republic for temporary lodging by creating a differentiated experience capitalizing on
      personal service and its amazing location in one of the most attractive parts of city, next to
      the famous 12th St district and our main competitor and city's biggest hotel: Hodelpa Gran
      Almirante Hotel & Casino. We plan to be more than a great hotel. We plan to create an
      enviroment of affordable luxury that surpasses the standards. Expanding our exposure via
      the Internet, introducing our facility to both business and leisure visitors, this will allow us
      to maintain a higher than average occupancy rate and above average profits.


1.1 Objectives

      The objetives of the Hotel Jardin for the firts three years of operation include:

          •     Open Hotel Jardin on July 15, 2007.
          •     Exceeding customer's expectations for business and leisure accomodations.
          •     Maintaining an 50% occupancy rate during the year.
          •     Assembling an experienced and effective staff.


1.2 Mission

      The mission of Hotel Jardin is to become the number one lodge of choice with visitors to
      Santiago, Dominican Republic.

      The Hotel Jardin guest will have every need met to ensure his/her comfort. For special
      occasions , catered meals, chilled wine, etc. can provided for an additional stipens.


                                       Highlights (Planned)


          $1,600,000

          $1,400,000

          $1,200,000

          $1,000,000
                                                                                   Sales
              $800,000                                                             Gross Margin

              $600,000                                                             Net Profit

              $400,000

              $200,000

                   $0
                            2008           2009            2010


                                                                                                  Page 1
Hotel Jardin

1.3 Keys to Success

     In order to succeed, the management will strive to achieve the following goals:

         •   Position Hotel Jardin as the best hotel in Santiago among numerous visitors.
         •   Build strong market position among the visitors.
         •   Maintain sound financial management of the venture.


2.0 Company Summary

     will be a new member in the exchange. will have 65 rooms, a parking facility near the
     hotel, 2 restaurants (1 outdoor restaurant in the roof) a gift shop and a conference room
     (capacity 20 PAX).

     Amenities that go beyond the typical Hotel will include:

         •   Pralines on pillows.
         •   A complimentary music CD for each room that the guest may keep.
         •   An extensive video and audio library for guest use.
         •   CD stereo systems and DVDs in each room.
         •   Two restaurants + cofee shops.
         •   A variety of herbal teas.
         •   Daily fresh-baked muffins and fresh fruit.
         •   Links to other business and services on the island.


2.1 Company Ownership

     Hotel Jardin will be wholly owned by GryDoz Hotels, a subsidiary of Grydoz Participaciones.


2.2 Start-up Summary


                                                                                            Page 2
Hotel Jardin


                                                    Start-up


                  $500,000
                  $450,000
                  $400,000
                  $350,000
                  $300,000
                  $250,000
                  $200,000
                  $150,000
                  $100,000
                   $50,000
                         $0
                                  Expenses         Assets   Investment   Loans


Table: Start-up

Start-up

Requirements

Start-up Expenses
Legal                                    $10,000
Stationery etc.                          $400
Marketing Plan                           $34,000
Lodge Setup                              $300,000
Insurance                                $20,000
Rent                                     $64,000
Other                                    $7,500
Total Start-up Expense                   $435,900

Start-up Assets Needed
Cash Balance on Starting Date            $64,100
Other Short-term Assets
Total Short-term Assets                  $64,100

Long-term Assets
Total Assets                             $64,100
Total Requirements                       $500,000

Funding

Investment
Investor 1                               $0
Investor 2                               $0
Other                                    $0
Total Investment                         $0

Short-term Liabilities
Accounts Payable                         $0
Current Borrowing                        $500,000
Other Short-term Liabilities             $0
Subtotal Short-term Liabilities          $500,000

Long-term Liabilities                    $0
Total Liabilities                        $500,000

Loss at Start-up                         ($435,900)
Total Capital                            ($435,900)
Total Capital and Liabilities            $64,100


                                                                                 Page 3
Hotel Jardin

3.0 Services

      Hotel Jardin will offer customers 65 roooms, as well as the following:

          •    2 restaurants.
          •    1 gift shop.
          •    1 confernce room.
          •    Front desk service.


4.0 Market Analysis Summary

      Hotel development and operation in the Satiago area has been very profitable and
      successful due to economic upturn experienced in early, mid 90's and the actual decade.
      Hotel development and investments into hotels and resorts nationwide are currently going
      strong. There are 3 hotels within 5 miles of the Hotel Jardin . each year, the average room
      occupancy rate is close to 75% during the year.New hotel facility is in its final contruction
      phase, will have 363 rooms, casino and golf course and will open in 2008.


4.1 Market Segmentation

      Our customers can be broadly divided into two groups:

          •    Business Travelers.
          •    Leisure Travelers.


      Table: Market Analysis

      Market Analysis
      Potential Customers            Growth     2007      2008       2009        2010        2011      CAGR
      Business Travelers                15%    81,500    93,725    107,784     123,952     142,545    15.00%
      Leisure Travelers                 15%    28,250    32,488     37,361      42,965      49,410    15.00%
      Total                          15.00%   109,750   126,213    145,145     166,917     191,955    15.00%


                                       Market Analysis (Pie)


                                                                               Business Travelers
                                                                               Leisure Travelers


                                                                                                    Page 4
Hotel Jardin

5.0 Strategy and Implementation Summary

      Hotel Jardin will aggresively market both businees and leisure visitors of the Santiago area.

      Our customers are looking for a different lodging experience that cannot be found in any of
      the other hotels. We will offer a comfortable , congenial enviroment that will assure return
      visits to the Hotel Jardin.

      The lodge will cost less and we will offer our customers all the services they need to make
      their stay memorable. We will offer two restaurants and 24 hrs room sevice.There will be a
      gift shop that will be able to to take special orders daily. Each evening, guests can gather in
      the roof restaurant where there is large fireplace, drinks and light music.


5.1 Competitive Edge

      The competitive edge of Hotel jardin is its location and. Being located in los Jardines
      Metropolitanos, next to the Hotel & Casino Gran Almirante and near to the 12th ST district.
      Simply close to everywhere.


5.2 Marketing Strategy

      The Hotel Jardin will habve its own website, web company partners and an effective
      advertising /promotion program that promotes the facility.

      In addition , Hotel Jardin will be highlighted in Magazines and TV shows.


5.3 Sales Strategy

      Hotel Jardin will sell rooms directly to repeat customers, as well as via traditional agents
      and through the internet. Repeat customers will have the privilege of priority reservations
      during the seasons. We will list Hotel Jardin on www.worldres.com, and other web pages
      and of course thru our own page www.grydozhotels.com, which will make it available to
      millions of international; prospects. Room rates for lodge will range from $ 125 - 65 per
      night.

5.3.1 Sales Forecast

      The following is the sales forecast for three years


                                                                                              Page 5
Hotel Jardin


                                  Sales Monthly (Planned)

     $100,000

      $90,000

      $80,000

      $70,000

      $60,000
                                                                       Rooms
      $50,000
                                                                       Foood + Drinks
      $40,000
                                                                       Other
      $30,000

      $20,000

      $10,000

           $0
                   Jul Ago Sep Oct Nov Dic Ene Feb Mar Abr May Jun


                                  Sales by Year (Planned)


    $1,600,000

    $1,400,000

    $1,200,000

    $1,000,000
                                                                       Rooms
     $800,000                                                          Foood + Drinks

     $600,000                                                          Other

     $400,000

     $200,000

           $0
                         2008          2009               2010


Table: Sales Forecast (Planned)

Sales Forecast
Sales                                   2008       2009       2010
Rooms                               $844,594   $971,283 $1,116,976
Foood + Drinks                      $236,487   $271,960   $312,754
Other                                 $28,650    $32,948    $37,890
Total Sales                        $1,109,731 $1,276,191 $1,467,619

Direct Cost of Sales                   2008       2009         2010
Rooms                                     $0         $0           $0
Foood + Drinks                      $115,876   $133,257     $153,246
Other                                $14,400    $16,560      $19,044
Subtotal Direct Cost of Sales       $130,276   $149,817     $172,290


                                                                                        Page 6
Hotel Jardin

6.0 Management Summary

      GryDoz Hotels will look for great individuals with a lot of experience and remarkable
      reputatation in the market.

6.1 Personnel Plan

      The personnel needed for the Hotel Jardin are the following:

           •   Manager
           •   Assistant Manager
           •   Lodge Staff (12)
           •   Office (4)
           •   Restaurants Staff (22)
           •   Gift Shop (3)
           •   Maintance Staff (4)
           •   Cleaning Staff (12)


      Table: Personnel (Planned)

       Personnel Plan
                                                  2008        2009       2010
       Manager                                  $54,000     $65,000    $71,500
       Assistant Manager                        $20,250     $39,000    $42,900
       Lodge Staff                              $48,600     $60,840    $66,924
       Office Staff                             $32,400     $39,000    $42,900
       Restaurants Staff                        $71,550    $106,600   $117,260
       Gift Shop Staff                           $9,535      $9,230    $10,153
       Maintance Staff                          $33,125     $34,450    $37,895
       Cleaning Staff                           $27,500     $30,250    $33,275
       Total Payroll                           $296,960    $384,370   $422,807

       Total People                                  63          63         63
       Payroll Burden                           $44,544     $57,656    $63,421
       Total Payroll Expenditures              $341,504    $442,026   $486,228

      Table: Sales Forecast (Planned)

       Sales Forecast
       Sales                                      2008       2009       2010
       Rooms                                  $844,594   $971,283 $1,116,976
       Foood + Drinks                         $236,487   $271,960   $312,754
       Other                                    $28,650    $32,948    $37,890
       Total Sales                           $1,109,731 $1,276,191 $1,467,619

       Direct Cost of Sales                       2008        2009       2010
       Rooms                                         $0          $0         $0
       Foood + Drinks                          $115,876    $133,257   $153,246
       Other                                    $14,400     $16,560    $19,044
       Subtotal Direct Cost of Sales           $130,276    $149,817   $172,290


7.0 Financial Plan

      The following is the financial plan for the Hotel Jardin.


                                                                                              Page 7
Hotel Jardin

7.1 Important Assumptions

      Table: General Assumptions

      General Assumptions
                                               2008       2009     2010
      Short-term Interest Rate %             10.00%     10.00%   10.00%
      Long-term Interest Rate %              10.00%     10.00%   10.00%
      Tax Rate %                             30.00%     30.00%   30.00%
      Expenses in Cash %                     10.00%     10.00%   10.00%
      Personnel Burden %                     15.00%     15.00%   15.00%


7.2 Break-even Analysis

      The monthly break-even point is $ 71,307.
      Table: Break-even Analysis

      Break-even Analysis:
      Monthly Units Break-even                   705
      Monthly Sales Break-even               $71,307

      Assumptions:
      Average Per-Unit Revenue               $101.11
      Average Per-Unit Variable Cost          $27.15
      Estimated Monthly Fixed Cost           $52,160


                                                   Break-even Analysis

          $40,000

          $20,000

               $0

         ($20,000)

         ($40,000)

         ($60,000)
                     $0            $20,222             $40,444      $60,666   $80,888   $101,110

                                                   Monthly break-even point

         Break-even point = where line intersects with 0


7.3 Projected Profit and Loss


                                                                                                   Page 8
Hotel Jardin

Table: Profit and Loss (Planned)

Pro Forma Profit and Loss
                                                              2008         2009         2010
Sales                                                  $1,109,731 $1,276,191 $1,467,619
Direct Cost of Sales                                    $130,276      $149,817     $172,290
Other Production Expenses                                         $0           $0           $0
                                                         ------------ ------------ ------------
Total Cost of Sales                                     $130,276      $149,817     $172,290
Gross Margin                                            $979,455 $1,126,374 $1,295,330
Gross Margin %                                             88.26%       88.26%       88.26%
Operating Expenses:
Advertising/Promotion                                    $68,250        $78,488      $90,261
Travel                                                           $0             $0           $0
Miscellaneous                                                    $0             $0           $0
Payroll Expense                                         $296,960       $384,370     $422,807
Payroll Burden                                           $44,544        $57,656      $63,421
Depreciation                                                     $0             $0           $0
Leased Equipment                                                 $0             $0           $0
Utilities                                                $74,750        $82,225      $90,448
Insurance                                                        $0             $0           $0
Rent                                                    $384,000       $384,000     $384,000
Contract/Consultants                                             $0             $0           $0
                                                        ------------   ------------ ------------
Total Operating Expenses                                $868,504       $986,738 $1,050,936
Profit Before Interest and Taxes                        $110,951       $139,636     $244,394
Interest Expense Short-term                              $50,000        $50,000      $50,000
Interest Expense Long-term                                       $0             $0           $0
Taxes Incurred                                           $18,285        $26,891      $58,318
Extraordinary Items                                              $0             $0           $0
Net Profit                                               $42,666        $62,745     $136,075
Net Profit/Sales                                            3.84%          4.92%        9.27%


                                       Profit Monthly (Planned)

                  $15,000

                  $10,000

                   $5,000

                        $0

                  ($5,000)

                 ($10,000)

                 ($15,000)

                 ($20,000)

                 ($25,000)
                               Jul   Ago Sep Oct Nov Dic Ene Feb Mar Abr May Jun


                                                                                                   Page 9
Hotel Jardin


                      Profit Yearly (Planned)


$140,000

$120,000

$100,000

 $80,000

 $60,000

 $40,000

 $20,000

     $0
                   2008           2009           2010


                 Gross Margin Monthly (Planned)

 $90,000

 $80,000

 $70,000

 $60,000

 $50,000

 $40,000

 $30,000

 $20,000

 $10,000

      $0
           Jul    Ago Sep Oct Nov Dic Ene Feb Mar Abr May Jun


                                                                Page 10
Hotel Jardin


                                        Gross Margin Yearly (Planned)


                      $1,400,000

                      $1,200,000

                      $1,000,000

                       $800,000

                       $600,000

                       $400,000

                       $200,000

                             $0
                                              2008          2009                2010


7.4 Projected Cash Flow

     Table: Cash Flow (Planned)

      Pro Forma Cash Flow                                                2008          2009      2010

      Cash Received
      Cash from Operations:
      Cash Sales                                                    $1,109,731 $1,276,191 $1,467,619
      From Receivables                                                      $0         $0         $0
        Subtotal Cash from Operations                               $1,109,731 $1,276,191 $1,467,619

      Additional Cash Received
      Extraordinary Items                                                   $0         $0         $0
      Sales Tax, VAT, HST/GST Received                                      $0         $0         $0
      New Current Borrowing                                                 $0         $0         $0
      New Other Liabilities (interest-free)                                 $0         $0         $0
      New Long-term Liabilities                                             $0         $0         $0
      Sales of other Short-term Assets                                      $0         $0         $0
      Sales of Long-term Assets                                             $0         $0         $0
      New Investment Received                                               $0         $0         $0
       Subtotal Cash Received                                       $1,109,731 $1,276,191 $1,467,619

      Expenditures                                                       2008          2009      2010
      Expenditures from Operations:
      Cash Spent on Costs and Expenses                                 $72,556    $77,142    $84,532
      Wages, Salaries, Payroll Taxes, etc.                           $341,504   $442,026   $486,228
      Payment of Accounts Payable                                    $598,986   $690,864   $755,282
       Subtotal Spent on Operations                                 $1,013,046 $1,210,031 $1,326,042

      Additional Cash Spent
      Sales Tax, VAT, HST/GST Paid Out                                      $0         $0         $0
      Principal Repayment of Current Borrowing                              $0         $0         $0
      Other Liabilities Principal Repayment                                 $0         $0         $0
      Long-term Liabilities Principal Repayment                             $0         $0         $0
      Purchase Other Short-term Assets                                      $0         $0         $0
      Purchase Long-term Assets                                             $0         $0         $0
      Dividends                                                             $0         $0         $0
        Adjustment for Assets Purchased on Credit                           $0         $0         $0
        Subtotal Cash Spent                                         $1,013,046 $1,210,031 $1,326,042

      Net Cash Flow                                                   $96,685      $66,159    $141,577


                                                                                                         Page 11
Hotel Jardin

      Cash Balance                                                       $160,785   $226,945   $368,522


                                                     Cash (Planned)

            $200,000


            $150,000


            $100,000
                                                                                                Net Cash Flow

             $50,000                                                                            Cash Balance


                   $0


           ($50,000)
                           Jul   Ago Sep Oct Nov Dic Ene Feb Mar Abr May Jun


7.5 Projected Balance Sheet

      Table: Balance Sheet (Planned)

      Pro Forma Balance Sheet

      Assets
      Short-term Assets                     2008         2009         2010
      Cash                               $160,785     $226,945     $368,522
      Other Short-term Assets                  $0           $0           $0
      Total Short-term Assets            $160,785     $226,945     $368,522
      Long-term Assets
      Long-term Assets                         $0           $0           $0
      Accumulated Depreciation                 $0           $0           $0
      Total Long-term Assets                   $0           $0           $0
      Total Assets                       $160,785     $226,945     $368,522

      Liabilities and Capital
                                            2008         2009         2010
      Accounts Payable                    $54,019      $57,434      $62,935
      Current Borrowing                  $500,000     $500,000     $500,000
      Other Short-term Liabilities             $0           $0           $0
      Subtotal Short-term Liabilities    $554,019     $557,434     $562,935

      Long-term Liabilities                    $0           $0           $0
      Total Liabilities                  $554,019     $557,434     $562,935

      Paid-in Capital                           $0           $0           $0
      Retained Earnings                 ($435,900)   ($393,234)   ($330,489)
      Earnings                             $42,666      $62,745     $136,075
      Total Capital                     ($393,234)   ($330,489)   ($194,414)
      Total Liabilities and Capital       $160,785     $226,945     $368,522
      Net Worth                         ($393,234)   ($330,489)   ($194,414)


                                                                                                               Page 12
Appendix

Appendix Table: Sales Forecast (Planned)

 Sales Forecast
 Sales                                          Jul       Ago       Sep       Oct         Nov       Dic       Ene       Feb       Mar       Abr      May        Jun
 Rooms                                     $37,538    $75,075   $75,075   $75,075     $75,075   $56,306   $75,075   $75,075   $75,075   $75,075   $75,075   $75,075
 Foood + Drinks                            $10,511    $21,021   $21,021   $21,021     $21,021   $15,766   $21,021   $21,021   $21,021   $21,021   $21,021   $21,021
 Other                                      $1,250     $2,500    $2,500    $2,500      $2,500    $2,400    $2,500    $2,500    $2,500    $2,500    $2,500    $2,500
 Total Sales                               $49,299    $98,596   $98,596   $98,596     $98,596   $74,472   $98,596   $98,596   $98,596   $98,596   $98,596   $98,596

 Direct Cost of Sales                           Jul       Ago       Sep       Oct         Nov       Dic       Ene       Feb       Mar       Abr      May        Jun
 Rooms                                          $0         $0        $0        $0          $0        $0        $0        $0        $0        $0        $0        $0
 Foood + Drinks                             $5,150    $10,300   $10,300   $10,300     $10,300    $7,725   $10,300   $10,300   $10,300   $10,300   $10,300   $10,300
 Other                                        $750     $1,250    $1,250    $1,250      $1,250    $1,200    $1,250    $1,250    $1,250    $1,200    $1,250    $1,250
 Subtotal Direct Cost of Sales              $5,900    $11,550   $11,550   $11,550     $11,550    $8,925   $11,550   $11,550   $11,550   $11,500   $11,550   $11,550


                                                                                                                                                                      Page 1
Appendix

Appendix Table: Personnel (Planned)

 Personnel Plan
                                           Jul       Ago       Sep       Oct         Nov       Dic       Ene       Feb       Mar       Abr      May        Jun
 Manager                               $2,000     $4,000    $4,000    $4,000      $4,000    $8,000    $4,000    $4,000    $4,000    $8,000    $4,000    $4,000
 Assistant Manager                       $750     $1,500    $1,500    $1,500      $1,500    $3,000    $1,500    $1,500    $1,500    $3,000    $1,500    $1,500
 Lodge Staff                           $1,800     $3,600    $3,600    $3,600      $3,600    $7,200    $3,600    $3,600    $3,600    $7,200    $3,600    $3,600
 Office Staff                          $1,200     $2,400    $2,400    $2,400      $2,400    $4,800    $2,400    $2,400    $2,400    $4,800    $2,400    $2,400
 Restaurants Staff                     $2,650     $5,300    $5,300    $5,300      $5,300   $10,600    $5,300    $5,300    $5,300   $10,600    $5,300    $5,300
 Gift Shop Staff                         $305      $710       $710      $710        $710    $1,420      $710      $710      $710    $1,420     $710       $710
 Maintance Staff                       $1,325     $2,650    $2,650    $2,650      $2,650    $5,300    $2,650    $2,650    $2,650    $2,650    $2,650    $2,650
 Cleaning Staff                        $1,100     $2,200    $2,200    $2,200      $2,200    $4,400    $2,200    $2,200    $2,200    $2,200    $2,200    $2,200
 Total Payroll                        $11,130    $22,360   $22,360   $22,360     $22,360   $44,720   $22,360   $22,360   $22,360   $39,870   $22,360   $22,360

 Total People                               0          0         0         0          63        63        63        63        63        63        63        63
 Payroll Burden                        $1,670     $3,354    $3,354    $3,354      $3,354    $6,708    $3,354    $3,354    $3,354    $5,981    $3,354    $3,354
 Total Payroll Expenditures           $12,800    $25,714   $25,714   $25,714     $25,714   $51,428   $25,714   $25,714   $25,714   $45,851   $25,714   $25,714


                                                                                                                                                                 Page 2
Appendix

Appendix Table: Sales Forecast (Planned)

 Sales Forecast
 Sales                                          Jul       Ago       Sep       Oct         Nov       Dic       Ene       Feb       Mar       Abr      May        Jun
 Rooms                                     $37,538    $75,075   $75,075   $75,075     $75,075   $56,306   $75,075   $75,075   $75,075   $75,075   $75,075   $75,075
 Foood + Drinks                            $10,511    $21,021   $21,021   $21,021     $21,021   $15,766   $21,021   $21,021   $21,021   $21,021   $21,021   $21,021
 Other                                      $1,250     $2,500    $2,500    $2,500      $2,500    $2,400    $2,500    $2,500    $2,500    $2,500    $2,500    $2,500
 Total Sales                               $49,299    $98,596   $98,596   $98,596     $98,596   $74,472   $98,596   $98,596   $98,596   $98,596   $98,596   $98,596

 Direct Cost of Sales                           Jul       Ago       Sep       Oct         Nov       Dic       Ene       Feb       Mar       Abr      May        Jun
 Rooms                                          $0         $0        $0        $0          $0        $0        $0        $0        $0        $0        $0        $0
 Foood + Drinks                             $5,150    $10,300   $10,300   $10,300     $10,300    $7,725   $10,300   $10,300   $10,300   $10,300   $10,300   $10,300
 Other                                        $750     $1,250    $1,250    $1,250      $1,250    $1,200    $1,250    $1,250    $1,250    $1,200    $1,250    $1,250
 Subtotal Direct Cost of Sales              $5,900    $11,550   $11,550   $11,550     $11,550    $8,925   $11,550   $11,550   $11,550   $11,500   $11,550   $11,550


                                                                                                                                                                      Page 3
Appendix

Appendix Table: General Assumptions

 General Assumptions
                                          Jul      Ago      Sep       Oct      Nov       Dic      Ene       Feb      Mar       Abr      May       Jun
 Short-term Interest Rate %           10.00%    10.00%   10.00%   10.00%    10.00%   10.00%    10.00%   10.00%    10.00%   10.00%    10.00%   10.00%
 Long-term Interest Rate %            10.00%    10.00%   10.00%   10.00%    10.00%   10.00%    10.00%   10.00%    10.00%   10.00%    10.00%   10.00%
 Tax Rate %                           30.00%    30.00%   30.00%   30.00%    30.00%   30.00%    30.00%   30.00%    30.00%   30.00%    30.00%   30.00%
 Expenses in Cash %                   10.00%    10.00%   10.00%   10.00%    10.00%   10.00%    10.00%   10.00%    10.00%   10.00%    10.00%   10.00%
 Personnel Burden %                   15.00%    15.00%   15.00%   15.00%    15.00%   15.00%    15.00%   15.00%    15.00%   15.00%    15.00%   15.00%


                                                                                                                                                        Page 4
Appendix

Appendix Table: Profit and Loss (Planned)

 Pro Forma Profit and Loss
                                                    Jul            Ago            Sep             Oct           Nov             Dic            Ene            Feb            Mar            Abr            May            Jun
 Sales                                       $49,299         $98,596        $98,596        $98,596        $98,596        $74,472         $98,596        $98,596        $98,596        $98,596        $98,596        $98,596
 Direct Cost of Sales                          $5,900        $11,550        $11,550        $11,550        $11,550          $8,925        $11,550        $11,550        $11,550        $11,500        $11,550        $11,550
 Other Production Expenses                           $0              $0             $0             $0             $0             $0              $0             $0             $0             $0             $0             $0
                                            ------------    ------------   ------------   ------------   ------------   ------------    ------------   ------------   ------------   ------------   ------------   ------------
 Total Cost of Sales                           $5,900        $11,550        $11,550        $11,550        $11,550          $8,925        $11,550        $11,550        $11,550        $11,500        $11,550        $11,550
 Gross Margin                                $43,399         $87,046        $87,046        $87,046        $87,046        $65,547         $87,046        $87,046        $87,046        $87,096        $87,046        $87,046
 Gross Margin %                               88.03%          88.29%         88.29%         88.29%         88.29%         88.02%          88.29%         88.29%         88.29%         88.34%         88.29%         88.29%
 Operating Expenses:
 Advertising/Promotion                        $13,000        $13,000        $13,000          $3,250         $3,250          $3,250         $3,250         $3,250         $3,250         $3,250         $3,250         $3,250
 Travel                                               $0             $0             $0             $0             $0              $0             $0             $0             $0             $0             $0             $0
 Miscellaneous                                        $0             $0             $0             $0             $0              $0             $0             $0             $0             $0             $0             $0
 Payroll Expense                              $11,130        $22,360        $22,360        $22,360        $22,360         $44,720        $22,360        $22,360        $22,360        $39,870        $22,360        $22,360
 Payroll Burden                                 $1,670         $3,354         $3,354         $3,354         $3,354          $6,708         $3,354         $3,354         $3,354         $5,981         $3,354         $3,354
 Depreciation                                         $0             $0             $0             $0             $0              $0             $0             $0             $0             $0             $0             $0
 Leased Equipment                                     $0             $0             $0             $0             $0              $0             $0             $0             $0             $0             $0             $0
 Utilities                                      $3,250         $6,500         $6,500         $6,500         $6,500          $6,500         $6,500         $6,500         $6,500         $6,500         $6,500         $6,500
 Insurance                                            $0             $0             $0             $0             $0              $0             $0             $0             $0             $0             $0             $0
 Rent                                         $32,000        $32,000        $32,000        $32,000        $32,000         $32,000        $32,000        $32,000        $32,000        $32,000        $32,000        $32,000
 Contract/Consultants                                 $0             $0             $0             $0             $0              $0             $0             $0             $0             $0             $0             $0
                                             ------------   ------------   ------------   ------------   ------------    ------------   ------------   ------------   ------------   ------------   ------------   ------------
 Total Operating Expenses                     $61,050        $77,214        $77,214        $67,464        $67,464         $93,178        $67,464        $67,464        $67,464        $87,601        $67,464        $67,464
 Profit Before Interest and Taxes           ($17,651)          $9,832         $9,832       $19,582        $19,582       ($27,631)        $19,582        $19,582        $19,582           ($505)      $19,582        $19,582
 Interest Expense Short-term                    $4,167         $4,167         $4,167         $4,167         $4,167          $4,167         $4,167         $4,167         $4,167         $4,167         $4,167         $4,167
 Interest Expense Long-term                           $0             $0             $0             $0             $0              $0             $0             $0             $0             $0             $0             $0
 Taxes Incurred                               ($6,545)         $1,700         $1,700         $4,625         $4,625        ($9,539)         $4,625         $4,625         $4,625       ($1,401)         $4,625         $4,625
 Extraordinary Items                                  $0             $0             $0             $0             $0              $0             $0             $0             $0             $0             $0             $0
 Net Profit                                 ($15,272)          $3,966         $3,966       $10,791        $10,791       ($22,259)        $10,791        $10,791        $10,791        ($3,270)       $10,791        $10,791
 Net Profit/Sales                             -30.98%           4.02%          4.02%        10.94%         10.94%         -29.89%         10.94%         10.94%         10.94%          -3.32%        10.94%         10.94%


                                                                                                                                                                                                                                  Page 5
Appendix

Appendix Table: Cash Flow (Planned)

 Pro Forma Cash Flow                                       Jul       Ago        Sep         Oct        Nov         Dic        Ene        Feb        Mar         Abr        May        Jun

 Cash Received
 Cash from Operations:
 Cash Sales                                            $49,299    $98,596    $98,596     $98,596    $98,596    $74,472     $98,596    $98,596    $98,596    $98,596     $98,596    $98,596
 From Receivables                                           $0         $0         $0          $0         $0         $0          $0         $0         $0         $0          $0         $0
   Subtotal Cash from Operations                       $49,299    $98,596    $98,596     $98,596    $98,596    $74,472     $98,596    $98,596    $98,596    $98,596     $98,596    $98,596

 Additional Cash Received
 Extraordinary Items                                        $0         $0         $0          $0         $0         $0          $0         $0         $0         $0          $0         $0
 Sales Tax, VAT, HST/GST Received              0.00%        $0         $0         $0          $0         $0         $0          $0         $0         $0         $0          $0         $0
 New Current Borrowing                                      $0         $0         $0          $0         $0         $0          $0         $0         $0         $0          $0         $0
 New Other Liabilities (interest-free)                      $0         $0         $0          $0         $0         $0          $0         $0         $0         $0          $0         $0
 New Long-term Liabilities                                  $0         $0         $0          $0         $0         $0          $0         $0         $0         $0          $0         $0
 Sales of other Short-term Assets                           $0         $0         $0          $0         $0         $0          $0         $0         $0         $0          $0         $0
 Sales of Long-term Assets                                  $0         $0         $0          $0         $0         $0          $0         $0         $0         $0          $0         $0
 New Investment Received                                    $0         $0         $0          $0         $0         $0          $0         $0         $0         $0          $0         $0
  Subtotal Cash Received                               $49,299    $98,596    $98,596     $98,596    $98,596    $74,472     $98,596    $98,596    $98,596    $98,596     $98,596    $98,596

 Expenditures                                              Jul       Ago        Sep         Oct        Nov         Dic        Ene        Feb        Mar         Abr        May        Jun
 Expenditures from Operations:
 Cash Spent on Costs and Expenses                       $5,177     $6,892     $6,892      $6,209     $6,209     $4,530      $6,209     $6,209     $6,209     $5,602      $6,209     $6,209
 Wages, Salaries, Payroll Taxes, etc.                  $12,800    $25,714    $25,714     $25,714    $25,714    $51,428     $25,714    $25,714    $25,714    $45,851     $25,714    $25,714
 Payment of Accounts Payable                            $1,553    $47,109    $62,025     $61,820    $55,882    $55,378     $41,276    $55,882    $55,882    $55,700     $50,596    $55,882
  Subtotal Spent on Operations                         $19,530    $79,714    $94,630     $93,743    $87,805   $111,337     $73,199    $87,805    $87,805   $107,152     $82,519    $87,805

 Additional Cash Spent
 Sales Tax, VAT, HST/GST Paid Out                           $0         $0         $0          $0         $0         $0          $0         $0         $0         $0          $0         $0
 Principal Repayment of Current Borrowing                   $0         $0         $0          $0         $0         $0          $0         $0         $0         $0          $0         $0
 Other Liabilities Principal Repayment                      $0         $0         $0          $0         $0         $0          $0         $0         $0         $0          $0         $0
 Long-term Liabilities Principal Repayment                  $0         $0         $0          $0         $0         $0          $0         $0         $0         $0          $0         $0
 Purchase Other Short-term Assets                           $0         $0         $0          $0         $0         $0          $0         $0         $0         $0          $0         $0
 Purchase Long-term Assets                                  $0         $0         $0          $0         $0         $0          $0         $0         $0         $0          $0         $0
 Dividends                                                  $0         $0         $0          $0         $0         $0          $0         $0         $0         $0          $0         $0
   Adjustment for Assets Purchased on Credit                $0         $0         $0          $0         $0         $0          $0         $0         $0         $0          $0         $0
   Subtotal Cash Spent                                 $19,530    $79,714    $94,630     $93,743    $87,805   $111,337     $73,199    $87,805    $87,805   $107,152     $82,519    $87,805

 Net Cash Flow                                         $29,769    $18,882     $3,966      $4,853    $10,791   ($36,865)    $25,397    $10,791    $10,791    ($8,556)    $16,077    $10,791
 Cash Balance                                          $93,869   $112,751   $116,717    $121,570   $132,360     $95,496   $120,892   $131,683   $142,474   $133,918    $149,995   $160,785


                                                                                                                                                                                             Page 6
Appendix

Appendix Table: Balance Sheet (Planned)

 Pro Forma Balance Sheet

 Assets
 Short-term Assets                 Starting Balances          Jul         Ago          Sep           Oct           Nov          Dic          Ene          Feb          Mar          Abr         May           Jun
 Cash                                        $64,100     $93,869     $112,751     $116,717      $121,570      $132,360      $95,496     $120,892     $131,683     $142,474     $133,918     $149,995     $160,785
 Other Short-term Assets                          $0          $0           $0           $0            $0            $0           $0           $0           $0           $0           $0           $0           $0
 Total Short-term Assets                     $64,100     $93,869     $112,751     $116,717      $121,570      $132,360      $95,496     $120,892     $131,683     $142,474     $133,918     $149,995     $160,785
 Long-term Assets
 Long-term Assets                                $0           $0           $0           $0            $0            $0           $0           $0           $0           $0           $0           $0           $0
 Accumulated Depreciation                        $0           $0           $0           $0            $0            $0           $0           $0           $0           $0           $0           $0           $0
 Total Long-term Assets                          $0           $0           $0           $0            $0            $0           $0           $0           $0           $0           $0           $0           $0
 Total Assets                               $64,100      $93,869     $112,751     $116,717      $121,570      $132,360      $95,496     $120,892     $131,683     $142,474     $133,918     $149,995     $160,785

 Liabilities and Capital
                                                              Jul         Ago          Sep           Oct           Nov          Dic          Ene          Feb          Mar          Abr         May           Jun
 Accounts Payable                                $0      $45,041      $59,957      $59,957       $54,019       $54,019      $39,413      $54,019      $54,019      $54,019      $48,734      $54,019      $54,019
 Current Borrowing                         $500,000     $500,000     $500,000     $500,000      $500,000      $500,000     $500,000     $500,000     $500,000     $500,000     $500,000     $500,000     $500,000
 Other Short-term Liabilities                    $0           $0           $0           $0            $0            $0           $0           $0           $0           $0           $0           $0           $0
 Subtotal Short-term Liabilities           $500,000     $545,041     $559,957     $559,957      $554,019      $554,019     $539,413     $554,019     $554,019     $554,019     $548,734     $554,019     $554,019

 Long-term Liabilities                           $0           $0           $0           $0            $0            $0           $0           $0           $0           $0           $0           $0           $0
 Total Liabilities                         $500,000     $545,041     $559,957     $559,957      $554,019      $554,019     $539,413     $554,019     $554,019     $554,019     $548,734     $554,019     $554,019

 Paid-in Capital                                  $0           $0           $0            $0           $0            $0           $0           $0           $0           $0           $0           $0           $0
 Retained Earnings                        ($435,900)   ($435,900)   ($435,900)   ($435,900)    ($435,900)    ($435,900)   ($435,900)   ($435,900)   ($435,900)   ($435,900)   ($435,900)   ($435,900)   ($435,900)
 Earnings                                         $0    ($15,272)    ($11,306)      ($7,341)       $3,450       $14,241     ($8,018)       $2,773      $13,564      $24,355      $21,084      $31,875      $42,666
 Total Capital                            ($435,900)   ($451,172)   ($447,206)   ($443,241)    ($432,450)    ($421,659)   ($443,918)   ($433,127)   ($422,336)   ($411,545)   ($414,816)   ($404,025)   ($393,234)
 Total Liabilities and Capital               $64,100      $93,869     $112,751     $116,717      $121,570      $132,360      $95,496     $120,892     $131,683     $142,474     $133,918     $149,995     $160,785
 Net Worth                                ($435,900)   ($451,172)   ($447,206)   ($443,241)    ($432,450)    ($421,659)   ($443,918)   ($433,127)   ($422,336)   ($411,545)   ($414,816)   ($404,025)   ($393,234)


                                                                                                                                                                                                                     Page 7

Mais conteúdo relacionado

Mais procurados

Vomitspawn hotel business plan
Vomitspawn hotel business planVomitspawn hotel business plan
Vomitspawn hotel business planAudreyyyyyy
 
Hotel business plan example
Hotel business plan exampleHotel business plan example
Hotel business plan exampleupmetrics.co
 
Vomitspawn hotel business plan
Vomitspawn hotel business planVomitspawn hotel business plan
Vomitspawn hotel business planZi Shan
 
vivanta by taj internship report
vivanta by taj internship report vivanta by taj internship report
vivanta by taj internship report Santosh Pathak
 
Hotel Industry
Hotel IndustryHotel Industry
Hotel Industryjaijai
 
Vivanta By TAJ- Organisational Study
Vivanta By TAJ- Organisational StudyVivanta By TAJ- Organisational Study
Vivanta By TAJ- Organisational StudySharath Murali
 
Radisson Blu Hotel Delhi By 2020
Radisson Blu Hotel Delhi By 2020Radisson Blu Hotel Delhi By 2020
Radisson Blu Hotel Delhi By 2020Debashish Mukherjee
 
Assignment taj hotels services by nilesh shukla
Assignment taj hotels services  by nilesh shuklaAssignment taj hotels services  by nilesh shukla
Assignment taj hotels services by nilesh shuklaNILESH SHUKLA
 
Nitin hospitality assignment
Nitin hospitality assignmentNitin hospitality assignment
Nitin hospitality assignmentNitin8998
 
Cafe presentation
Cafe presentationCafe presentation
Cafe presentationLynette Law
 
Hospitality
HospitalityHospitality
Hospitalityabhi9959
 
The ritz carlton hotel
The ritz carlton hotelThe ritz carlton hotel
The ritz carlton hotelPravesh Kaswan
 
Le meridien group of hotel
Le meridien group of hotelLe meridien group of hotel
Le meridien group of hotelbilbinp
 
Company Audit- Marriott 2
Company Audit- Marriott 2Company Audit- Marriott 2
Company Audit- Marriott 2Ty Oden
 
IT_Report_Final.compressed
IT_Report_Final.compressedIT_Report_Final.compressed
IT_Report_Final.compressedNomaan Shaikh
 
Business plan on hotel in Goa never regret Downloading it
Business plan on hotel in Goa never regret Downloading itBusiness plan on hotel in Goa never regret Downloading it
Business plan on hotel in Goa never regret Downloading itShrey Kapoor
 
INTERNSHIP ON VIHAS HOTEL
INTERNSHIP ON VIHAS HOTELINTERNSHIP ON VIHAS HOTEL
INTERNSHIP ON VIHAS HOTELHARI KATAM
 

Mais procurados (20)

Vomitspawn hotel business plan
Vomitspawn hotel business planVomitspawn hotel business plan
Vomitspawn hotel business plan
 
Hotel business plan example
Hotel business plan exampleHotel business plan example
Hotel business plan example
 
Vomitspawn hotel business plan
Vomitspawn hotel business planVomitspawn hotel business plan
Vomitspawn hotel business plan
 
vivanta by taj internship report
vivanta by taj internship report vivanta by taj internship report
vivanta by taj internship report
 
Hotel Industry
Hotel IndustryHotel Industry
Hotel Industry
 
Vivanta By TAJ- Organisational Study
Vivanta By TAJ- Organisational StudyVivanta By TAJ- Organisational Study
Vivanta By TAJ- Organisational Study
 
Radisson Blu Hotel Delhi By 2020
Radisson Blu Hotel Delhi By 2020Radisson Blu Hotel Delhi By 2020
Radisson Blu Hotel Delhi By 2020
 
Assignment taj hotels services by nilesh shukla
Assignment taj hotels services  by nilesh shuklaAssignment taj hotels services  by nilesh shukla
Assignment taj hotels services by nilesh shukla
 
Nitin hospitality assignment
Nitin hospitality assignmentNitin hospitality assignment
Nitin hospitality assignment
 
Cafe presentation
Cafe presentationCafe presentation
Cafe presentation
 
iti report
iti reportiti report
iti report
 
Hospitality
HospitalityHospitality
Hospitality
 
intership report
intership reportintership report
intership report
 
The ritz carlton hotel
The ritz carlton hotelThe ritz carlton hotel
The ritz carlton hotel
 
Le meridien group of hotel
Le meridien group of hotelLe meridien group of hotel
Le meridien group of hotel
 
Company Audit- Marriott 2
Company Audit- Marriott 2Company Audit- Marriott 2
Company Audit- Marriott 2
 
IT_Report_Final.compressed
IT_Report_Final.compressedIT_Report_Final.compressed
IT_Report_Final.compressed
 
Business plan on hotel in Goa never regret Downloading it
Business plan on hotel in Goa never regret Downloading itBusiness plan on hotel in Goa never regret Downloading it
Business plan on hotel in Goa never regret Downloading it
 
JW Marriot
JW MarriotJW Marriot
JW Marriot
 
INTERNSHIP ON VIHAS HOTEL
INTERNSHIP ON VIHAS HOTELINTERNSHIP ON VIHAS HOTEL
INTERNSHIP ON VIHAS HOTEL
 

Destaque

Business Plan "New Hotel Enterprise"
Business Plan "New Hotel Enterprise"Business Plan "New Hotel Enterprise"
Business Plan "New Hotel Enterprise"MTM IULM
 
Design a Business plan for a hotel network in Italy
Design a Business plan for a hotel network in ItalyDesign a Business plan for a hotel network in Italy
Design a Business plan for a hotel network in ItalyValentina Rigamonti
 
Happy Arty Hotel Barcelona
Happy Arty Hotel BarcelonaHappy Arty Hotel Barcelona
Happy Arty Hotel BarcelonaBen Canzano
 
Business Plan - Hotel Resort in Abu Dhabi
Business Plan - Hotel Resort in Abu DhabiBusiness Plan - Hotel Resort in Abu Dhabi
Business Plan - Hotel Resort in Abu DhabiIlliès Boussaha
 
Group 2 marketing plan the premiere business hotel new
Group 2 marketing plan the premiere business hotel newGroup 2 marketing plan the premiere business hotel new
Group 2 marketing plan the premiere business hotel newMarcelo Augusto A. Cosgayon
 
Business plan final report
Business plan   final reportBusiness plan   final report
Business plan final reportXuân Uyên Ngô
 
Presentation on aakash tablet (1)
Presentation on aakash tablet (1)Presentation on aakash tablet (1)
Presentation on aakash tablet (1)aman1001
 
Fnbe 0814- intro to business -Vomitspawn hotel business plan
Fnbe 0814- intro to business -Vomitspawn hotel business planFnbe 0814- intro to business -Vomitspawn hotel business plan
Fnbe 0814- intro to business -Vomitspawn hotel business plankaiwenyeo
 
Business plan powerpoint
Business plan powerpointBusiness plan powerpoint
Business plan powerpointiphani6
 
Plan de-afaceri-antreprenoriat-calcul
Plan de-afaceri-antreprenoriat-calculPlan de-afaceri-antreprenoriat-calcul
Plan de-afaceri-antreprenoriat-calculAlexandra Grg
 
Project Construction of 5 star hotel
Project Construction of 5 star hotelProject Construction of 5 star hotel
Project Construction of 5 star hotelMuhammad Farhan Javed
 
Entrepreneurship project business plan template
Entrepreneurship project   business plan templateEntrepreneurship project   business plan template
Entrepreneurship project business plan templateNeelam Dey
 

Destaque (15)

Business Plan "New Hotel Enterprise"
Business Plan "New Hotel Enterprise"Business Plan "New Hotel Enterprise"
Business Plan "New Hotel Enterprise"
 
Design a Business plan for a hotel network in Italy
Design a Business plan for a hotel network in ItalyDesign a Business plan for a hotel network in Italy
Design a Business plan for a hotel network in Italy
 
Happy Arty Hotel Barcelona
Happy Arty Hotel BarcelonaHappy Arty Hotel Barcelona
Happy Arty Hotel Barcelona
 
Business Plan - Hotel Resort in Abu Dhabi
Business Plan - Hotel Resort in Abu DhabiBusiness Plan - Hotel Resort in Abu Dhabi
Business Plan - Hotel Resort in Abu Dhabi
 
Business Plan
Business PlanBusiness Plan
Business Plan
 
Group 2 marketing plan the premiere business hotel new
Group 2 marketing plan the premiere business hotel newGroup 2 marketing plan the premiere business hotel new
Group 2 marketing plan the premiere business hotel new
 
Business plan final report
Business plan   final reportBusiness plan   final report
Business plan final report
 
Presentation on aakash tablet (1)
Presentation on aakash tablet (1)Presentation on aakash tablet (1)
Presentation on aakash tablet (1)
 
Fnbe 0814- intro to business -Vomitspawn hotel business plan
Fnbe 0814- intro to business -Vomitspawn hotel business planFnbe 0814- intro to business -Vomitspawn hotel business plan
Fnbe 0814- intro to business -Vomitspawn hotel business plan
 
Business plan powerpoint
Business plan powerpointBusiness plan powerpoint
Business plan powerpoint
 
Report on new Business plan to set up a 7 star hotels
Report on new Business plan to set up a 7 star hotels Report on new Business plan to set up a 7 star hotels
Report on new Business plan to set up a 7 star hotels
 
Plan de afaceri hotel
Plan de afaceri hotelPlan de afaceri hotel
Plan de afaceri hotel
 
Plan de-afaceri-antreprenoriat-calcul
Plan de-afaceri-antreprenoriat-calculPlan de-afaceri-antreprenoriat-calcul
Plan de-afaceri-antreprenoriat-calcul
 
Project Construction of 5 star hotel
Project Construction of 5 star hotelProject Construction of 5 star hotel
Project Construction of 5 star hotel
 
Entrepreneurship project business plan template
Entrepreneurship project   business plan templateEntrepreneurship project   business plan template
Entrepreneurship project business plan template
 

Semelhante a Business Plan: Hotel Jardin

Semelhante a Business Plan: Hotel Jardin (20)

Discount pharmacy
Discount pharmacyDiscount pharmacy
Discount pharmacy
 
Discount pharmacy
Discount pharmacyDiscount pharmacy
Discount pharmacy
 
Discount pharmacy marketing plan
Discount pharmacy marketing planDiscount pharmacy marketing plan
Discount pharmacy marketing plan
 
Takefive live
Takefive liveTakefive live
Takefive live
 
about start up for you 9
about start up for you 9about start up for you 9
about start up for you 9
 
Studio67 ref model
Studio67 ref modelStudio67 ref model
Studio67 ref model
 
Business plan startup
Business plan startupBusiness plan startup
Business plan startup
 
about start up for you 3
about start up for you 3about start up for you 3
about start up for you 3
 
Ice Cream Dreams - Bussiness Plan Sample
Ice Cream Dreams - Bussiness Plan SampleIce Cream Dreams - Bussiness Plan Sample
Ice Cream Dreams - Bussiness Plan Sample
 
Event plan personal
Event plan personalEvent plan personal
Event plan personal
 
Studio67 live
Studio67 liveStudio67 live
Studio67 live
 
Box Werkz Business Plan
Box Werkz Business PlanBox Werkz Business Plan
Box Werkz Business Plan
 
Chef vending mpp
Chef vending mppChef vending mpp
Chef vending mpp
 
Buisness Plan V1
Buisness Plan V1Buisness Plan V1
Buisness Plan V1
 
Watertowercafe live
Watertowercafe liveWatertowercafe live
Watertowercafe live
 
GCG Gaming Business Plan
GCG Gaming Business PlanGCG Gaming Business Plan
GCG Gaming Business Plan
 
ccc_2001AR
ccc_2001ARccc_2001AR
ccc_2001AR
 
Sample biz plan
Sample biz planSample biz plan
Sample biz plan
 
Mobile Media Incorporated
Mobile Media IncorporatedMobile Media Incorporated
Mobile Media Incorporated
 
Acmeconsulting mpp live
Acmeconsulting mpp liveAcmeconsulting mpp live
Acmeconsulting mpp live
 

Último

Planetary and Vedic Yagyas Bring Positive Impacts in Life
Planetary and Vedic Yagyas Bring Positive Impacts in LifePlanetary and Vedic Yagyas Bring Positive Impacts in Life
Planetary and Vedic Yagyas Bring Positive Impacts in LifeBhavana Pujan Kendra
 
Neha Jhalani Hiranandani: A Guide to Her Life and Career
Neha Jhalani Hiranandani: A Guide to Her Life and CareerNeha Jhalani Hiranandani: A Guide to Her Life and Career
Neha Jhalani Hiranandani: A Guide to Her Life and Careerr98588472
 
Jewish Resources in the Family Resource Centre
Jewish Resources in the Family Resource CentreJewish Resources in the Family Resource Centre
Jewish Resources in the Family Resource CentreNZSG
 
MEP Plans in Construction of Building and Industrial Projects 2024
MEP Plans in Construction of Building and Industrial Projects 2024MEP Plans in Construction of Building and Industrial Projects 2024
MEP Plans in Construction of Building and Industrial Projects 2024Chandresh Chudasama
 
Intermediate Accounting, Volume 2, 13th Canadian Edition by Donald E. Kieso t...
Intermediate Accounting, Volume 2, 13th Canadian Edition by Donald E. Kieso t...Intermediate Accounting, Volume 2, 13th Canadian Edition by Donald E. Kieso t...
Intermediate Accounting, Volume 2, 13th Canadian Edition by Donald E. Kieso t...ssuserf63bd7
 
Simplify Your Funding: Quick and Easy Business Loans
Simplify Your Funding: Quick and Easy Business LoansSimplify Your Funding: Quick and Easy Business Loans
Simplify Your Funding: Quick and Easy Business LoansNugget Global
 
Rakhi sets symbolizing the bond of love.pptx
Rakhi sets symbolizing the bond of love.pptxRakhi sets symbolizing the bond of love.pptx
Rakhi sets symbolizing the bond of love.pptxRakhi Bazaar
 
Customizable Contents Restoration Training
Customizable Contents Restoration TrainingCustomizable Contents Restoration Training
Customizable Contents Restoration TrainingCalvinarnold843
 
Excvation Safety for safety officers reference
Excvation Safety for safety officers referenceExcvation Safety for safety officers reference
Excvation Safety for safety officers referencessuser2c065e
 
Interoperability and ecosystems: Assembling the industrial metaverse
Interoperability and ecosystems:  Assembling the industrial metaverseInteroperability and ecosystems:  Assembling the industrial metaverse
Interoperability and ecosystems: Assembling the industrial metaverseSiemens
 
Unveiling the Soundscape Music for Psychedelic Experiences
Unveiling the Soundscape Music for Psychedelic ExperiencesUnveiling the Soundscape Music for Psychedelic Experiences
Unveiling the Soundscape Music for Psychedelic ExperiencesDoe Paoro
 
Data Analytics Strategy Toolkit and Templates
Data Analytics Strategy Toolkit and TemplatesData Analytics Strategy Toolkit and Templates
Data Analytics Strategy Toolkit and TemplatesAurelien Domont, MBA
 
Strategic Project Finance Essentials: A Project Manager’s Guide to Financial ...
Strategic Project Finance Essentials: A Project Manager’s Guide to Financial ...Strategic Project Finance Essentials: A Project Manager’s Guide to Financial ...
Strategic Project Finance Essentials: A Project Manager’s Guide to Financial ...Aggregage
 
Pitch Deck Teardown: Xpanceo's $40M Seed deck
Pitch Deck Teardown: Xpanceo's $40M Seed deckPitch Deck Teardown: Xpanceo's $40M Seed deck
Pitch Deck Teardown: Xpanceo's $40M Seed deckHajeJanKamps
 
Fundamentals Welcome and Inclusive DEIB
Fundamentals Welcome and  Inclusive DEIBFundamentals Welcome and  Inclusive DEIB
Fundamentals Welcome and Inclusive DEIBGregory DeShields
 
14680-51-4.pdf Good quality CAS Good quality CAS
14680-51-4.pdf  Good  quality CAS Good  quality CAS14680-51-4.pdf  Good  quality CAS Good  quality CAS
14680-51-4.pdf Good quality CAS Good quality CAScathy664059
 
NAB Show Exhibitor List 2024 - Exhibitors Data
NAB Show Exhibitor List 2024 - Exhibitors DataNAB Show Exhibitor List 2024 - Exhibitors Data
NAB Show Exhibitor List 2024 - Exhibitors DataExhibitors Data
 
The McKinsey 7S Framework: A Holistic Approach to Harmonizing All Parts of th...
The McKinsey 7S Framework: A Holistic Approach to Harmonizing All Parts of th...The McKinsey 7S Framework: A Holistic Approach to Harmonizing All Parts of th...
The McKinsey 7S Framework: A Holistic Approach to Harmonizing All Parts of th...Operational Excellence Consulting
 
Onemonitar Android Spy App Features: Explore Advanced Monitoring Capabilities
Onemonitar Android Spy App Features: Explore Advanced Monitoring CapabilitiesOnemonitar Android Spy App Features: Explore Advanced Monitoring Capabilities
Onemonitar Android Spy App Features: Explore Advanced Monitoring CapabilitiesOne Monitar
 
WSMM Media and Entertainment Feb_March_Final.pdf
WSMM Media and Entertainment Feb_March_Final.pdfWSMM Media and Entertainment Feb_March_Final.pdf
WSMM Media and Entertainment Feb_March_Final.pdfJamesConcepcion7
 

Último (20)

Planetary and Vedic Yagyas Bring Positive Impacts in Life
Planetary and Vedic Yagyas Bring Positive Impacts in LifePlanetary and Vedic Yagyas Bring Positive Impacts in Life
Planetary and Vedic Yagyas Bring Positive Impacts in Life
 
Neha Jhalani Hiranandani: A Guide to Her Life and Career
Neha Jhalani Hiranandani: A Guide to Her Life and CareerNeha Jhalani Hiranandani: A Guide to Her Life and Career
Neha Jhalani Hiranandani: A Guide to Her Life and Career
 
Jewish Resources in the Family Resource Centre
Jewish Resources in the Family Resource CentreJewish Resources in the Family Resource Centre
Jewish Resources in the Family Resource Centre
 
MEP Plans in Construction of Building and Industrial Projects 2024
MEP Plans in Construction of Building and Industrial Projects 2024MEP Plans in Construction of Building and Industrial Projects 2024
MEP Plans in Construction of Building and Industrial Projects 2024
 
Intermediate Accounting, Volume 2, 13th Canadian Edition by Donald E. Kieso t...
Intermediate Accounting, Volume 2, 13th Canadian Edition by Donald E. Kieso t...Intermediate Accounting, Volume 2, 13th Canadian Edition by Donald E. Kieso t...
Intermediate Accounting, Volume 2, 13th Canadian Edition by Donald E. Kieso t...
 
Simplify Your Funding: Quick and Easy Business Loans
Simplify Your Funding: Quick and Easy Business LoansSimplify Your Funding: Quick and Easy Business Loans
Simplify Your Funding: Quick and Easy Business Loans
 
Rakhi sets symbolizing the bond of love.pptx
Rakhi sets symbolizing the bond of love.pptxRakhi sets symbolizing the bond of love.pptx
Rakhi sets symbolizing the bond of love.pptx
 
Customizable Contents Restoration Training
Customizable Contents Restoration TrainingCustomizable Contents Restoration Training
Customizable Contents Restoration Training
 
Excvation Safety for safety officers reference
Excvation Safety for safety officers referenceExcvation Safety for safety officers reference
Excvation Safety for safety officers reference
 
Interoperability and ecosystems: Assembling the industrial metaverse
Interoperability and ecosystems:  Assembling the industrial metaverseInteroperability and ecosystems:  Assembling the industrial metaverse
Interoperability and ecosystems: Assembling the industrial metaverse
 
Unveiling the Soundscape Music for Psychedelic Experiences
Unveiling the Soundscape Music for Psychedelic ExperiencesUnveiling the Soundscape Music for Psychedelic Experiences
Unveiling the Soundscape Music for Psychedelic Experiences
 
Data Analytics Strategy Toolkit and Templates
Data Analytics Strategy Toolkit and TemplatesData Analytics Strategy Toolkit and Templates
Data Analytics Strategy Toolkit and Templates
 
Strategic Project Finance Essentials: A Project Manager’s Guide to Financial ...
Strategic Project Finance Essentials: A Project Manager’s Guide to Financial ...Strategic Project Finance Essentials: A Project Manager’s Guide to Financial ...
Strategic Project Finance Essentials: A Project Manager’s Guide to Financial ...
 
Pitch Deck Teardown: Xpanceo's $40M Seed deck
Pitch Deck Teardown: Xpanceo's $40M Seed deckPitch Deck Teardown: Xpanceo's $40M Seed deck
Pitch Deck Teardown: Xpanceo's $40M Seed deck
 
Fundamentals Welcome and Inclusive DEIB
Fundamentals Welcome and  Inclusive DEIBFundamentals Welcome and  Inclusive DEIB
Fundamentals Welcome and Inclusive DEIB
 
14680-51-4.pdf Good quality CAS Good quality CAS
14680-51-4.pdf  Good  quality CAS Good  quality CAS14680-51-4.pdf  Good  quality CAS Good  quality CAS
14680-51-4.pdf Good quality CAS Good quality CAS
 
NAB Show Exhibitor List 2024 - Exhibitors Data
NAB Show Exhibitor List 2024 - Exhibitors DataNAB Show Exhibitor List 2024 - Exhibitors Data
NAB Show Exhibitor List 2024 - Exhibitors Data
 
The McKinsey 7S Framework: A Holistic Approach to Harmonizing All Parts of th...
The McKinsey 7S Framework: A Holistic Approach to Harmonizing All Parts of th...The McKinsey 7S Framework: A Holistic Approach to Harmonizing All Parts of th...
The McKinsey 7S Framework: A Holistic Approach to Harmonizing All Parts of th...
 
Onemonitar Android Spy App Features: Explore Advanced Monitoring Capabilities
Onemonitar Android Spy App Features: Explore Advanced Monitoring CapabilitiesOnemonitar Android Spy App Features: Explore Advanced Monitoring Capabilities
Onemonitar Android Spy App Features: Explore Advanced Monitoring Capabilities
 
WSMM Media and Entertainment Feb_March_Final.pdf
WSMM Media and Entertainment Feb_March_Final.pdfWSMM Media and Entertainment Feb_March_Final.pdf
WSMM Media and Entertainment Feb_March_Final.pdf
 

Business Plan: Hotel Jardin

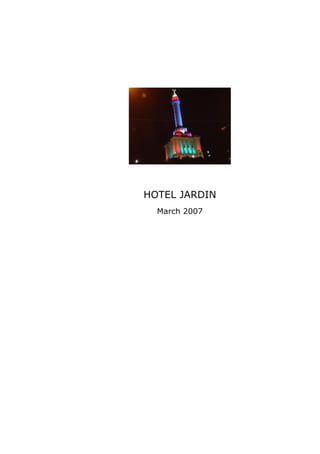
  • 1. HOTEL JARDIN March 2007
  • 2. Confidentiality Agreement The undersigned reader acknowledges that the information provided by _______________ in this business plan is confidential; therefore, reader agrees not to disclose it without the express written permission of _______________. It is acknowledged by reader that information to be furnished in this business plan is in all respects confidential in nature, other than information which is in the public domain through other means and that any disclosure or use of same by reader, may cause serious harm or damage to _______________. Upon request, this document is to be immediately returned to _______________. ___________________ Signature ___________________ Name (typed or printed) ___________________ Date This is a business plan. It does not imply an offering of securities.
  • 3. Table of Contents 1.0 Executive Summary . . . . . . . . . . . . . . . . . . . . . . . . . . . . . . . . . . . . . . . . . . . . . . . . . . . . . . . . . . . . . . . . . . . . . . 1 1.1 Objectives . . . . . . . . . . . . . . . . . . . . . . . . . . . . . . . . . . . . . . . . . . . . . . . . . . . . . . . . . . . . . . . . . . . . . . . 1 1.2 Mission . . . . . . . . . . . . . . . . . . . . . . . . . . . . . . . . . . . . . . . . . . . . . . . . . . . . . . . . . . . . . . . . . . . . . . . . . 1 1.3 Keys to Success . . . . . . . . . . . . . . . . . . . . . . . . . . . . . . . . . . . . . . . . . . . . . . . . . . . . . . . . . . . . . . . . . . . 2 2.0 Company Summary . . . . . . . . . . . . . . . . . . . . . . . . . . . . . . . . . . . . . . . . . . . . . . . . . . . . . . . . . . . . . . . . . . . . . . 2 2.1 Company Ownership . . . . . . . . . . . . . . . . . . . . . . . . . . . . . . . . . . . . . . . . . . . . . . . . . . . . . . . . . . . . . . 2 2.2 Start-up Summary . . . . . . . . . . . . . . . . . . . . . . . . . . . . . . . . . . . . . . . . . . . . . . . . . . . . . . . . . . . . . . . . . 2 3.0 Services . . . . . . . . . . . . . . . . . . . . . . . . . . . . . . . . . . . . . . . . . . . . . . . . . . . . . . . . . . . . . . . . . . . . . . . . . . . . . . . . 4 4.0 Market Analysis Summary . . . . . . . . . . . . . . . . . . . . . . . . . . . . . . . . . . . . . . . . . . . . . . . . . . . . . . . . . . . . . . . . 4 4.1 Market Segmentation . . . . . . . . . . . . . . . . . . . . . . . . . . . . . . . . . . . . . . . . . . . . . . . . . . . . . . . . . . . . . . 4 5.0 Strategy and Implementation Summary . . . . . . . . . . . . . . . . . . . . . . . . . . . . . . . . . . . . . . . . . . . . . . . . . . . . 5 5.1 Competitive Edge . . . . . . . . . . . . . . . . . . . . . . . . . . . . . . . . . . . . . . . . . . . . . . . . . . . . . . . . . . . . . . . . . 5 5.2 Marketing Strategy . . . . . . . . . . . . . . . . . . . . . . . . . . . . . . . . . . . . . . . . . . . . . . . . . . . . . . . . . . . . . . . . 5 5.3 Sales Strategy . . . . . . . . . . . . . . . . . . . . . . . . . . . . . . . . . . . . . . . . . . . . . . . . . . . . . . . . . . . . . . . . . . . . 5 5.3.1 Sales Forecast . . . . . . . . . . . . . . . . . . . . . . . . . . . . . . . . . . . . . . . . . . . . . . . . . . . . . . . . . . . . . 5 6.0 Management Summary . . . . . . . . . . . . . . . . . . . . . . . . . . . . . . . . . . . . . . . . . . . . . . . . . . . . . . . . . . . . . . . . . . . 7 6.1 Personnel Plan . . . . . . . . . . . . . . . . . . . . . . . . . . . . . . . . . . . . . . . . . . . . . . . . . . . . . . . . . . . . . . . . . . . 7 7.0 Financial Plan . . . . . . . . . . . . . . . . . . . . . . . . . . . . . . . . . . . . . . . . . . . . . . . . . . . . . . . . . . . . . . . . . . . . . . . . . . 7 7.1 Important Assumptions . . . . . . . . . . . . . . . . . . . . . . . . . . . . . . . . . . . . . . . . . . . . . . . . . . . . . . . . . . . . 8 7.2 Break-even Analysis . . . . . . . . . . . . . . . . . . . . . . . . . . . . . . . . . . . . . . . . . . . . . . . . . . . . . . . . . . . . . . . 8 7.3 Projected Profit and Loss . . . . . . . . . . . . . . . . . . . . . . . . . . . . . . . . . . . . . . . . . . . . . . . . . . . . . . . . . . . 8 7.4 Projected Cash Flow . . . . . . . . . . . . . . . . . . . . . . . . . . . . . . . . . . . . . . . . . . . . . . . . . . . . . . . . . . . . . . . 11 7.5 Projected Balance Sheet . . . . . . . . . . . . . . . . . . . . . . . . . . . . . . . . . . . . . . . . . . . . . . . . . . . . . . . . . . . . 12
  • 4. Hotel Jardin 1.0 Executive Summary Introduction The Long-goal of Hotel Jardin is to become one of the best choices on Santiago, Dominican Republic for temporary lodging by creating a differentiated experience capitalizing on personal service and its amazing location in one of the most attractive parts of city, next to the famous 12th St district and our main competitor and city's biggest hotel: Hodelpa Gran Almirante Hotel & Casino. We plan to be more than a great hotel. We plan to create an enviroment of affordable luxury that surpasses the standards. Expanding our exposure via the Internet, introducing our facility to both business and leisure visitors, this will allow us to maintain a higher than average occupancy rate and above average profits. 1.1 Objectives The objetives of the Hotel Jardin for the firts three years of operation include: • Open Hotel Jardin on July 15, 2007. • Exceeding customer's expectations for business and leisure accomodations. • Maintaining an 50% occupancy rate during the year. • Assembling an experienced and effective staff. 1.2 Mission The mission of Hotel Jardin is to become the number one lodge of choice with visitors to Santiago, Dominican Republic. The Hotel Jardin guest will have every need met to ensure his/her comfort. For special occasions , catered meals, chilled wine, etc. can provided for an additional stipens. Highlights (Planned) $1,600,000 $1,400,000 $1,200,000 $1,000,000 Sales $800,000 Gross Margin $600,000 Net Profit $400,000 $200,000 $0 2008 2009 2010 Page 1
  • 5. Hotel Jardin 1.3 Keys to Success In order to succeed, the management will strive to achieve the following goals: • Position Hotel Jardin as the best hotel in Santiago among numerous visitors. • Build strong market position among the visitors. • Maintain sound financial management of the venture. 2.0 Company Summary will be a new member in the exchange. will have 65 rooms, a parking facility near the hotel, 2 restaurants (1 outdoor restaurant in the roof) a gift shop and a conference room (capacity 20 PAX). Amenities that go beyond the typical Hotel will include: • Pralines on pillows. • A complimentary music CD for each room that the guest may keep. • An extensive video and audio library for guest use. • CD stereo systems and DVDs in each room. • Two restaurants + cofee shops. • A variety of herbal teas. • Daily fresh-baked muffins and fresh fruit. • Links to other business and services on the island. 2.1 Company Ownership Hotel Jardin will be wholly owned by GryDoz Hotels, a subsidiary of Grydoz Participaciones. 2.2 Start-up Summary Page 2
  • 6. Hotel Jardin Start-up $500,000 $450,000 $400,000 $350,000 $300,000 $250,000 $200,000 $150,000 $100,000 $50,000 $0 Expenses Assets Investment Loans Table: Start-up Start-up Requirements Start-up Expenses Legal $10,000 Stationery etc. $400 Marketing Plan $34,000 Lodge Setup $300,000 Insurance $20,000 Rent $64,000 Other $7,500 Total Start-up Expense $435,900 Start-up Assets Needed Cash Balance on Starting Date $64,100 Other Short-term Assets Total Short-term Assets $64,100 Long-term Assets Total Assets $64,100 Total Requirements $500,000 Funding Investment Investor 1 $0 Investor 2 $0 Other $0 Total Investment $0 Short-term Liabilities Accounts Payable $0 Current Borrowing $500,000 Other Short-term Liabilities $0 Subtotal Short-term Liabilities $500,000 Long-term Liabilities $0 Total Liabilities $500,000 Loss at Start-up ($435,900) Total Capital ($435,900) Total Capital and Liabilities $64,100 Page 3
  • 7. Hotel Jardin 3.0 Services Hotel Jardin will offer customers 65 roooms, as well as the following: • 2 restaurants. • 1 gift shop. • 1 confernce room. • Front desk service. 4.0 Market Analysis Summary Hotel development and operation in the Satiago area has been very profitable and successful due to economic upturn experienced in early, mid 90's and the actual decade. Hotel development and investments into hotels and resorts nationwide are currently going strong. There are 3 hotels within 5 miles of the Hotel Jardin . each year, the average room occupancy rate is close to 75% during the year.New hotel facility is in its final contruction phase, will have 363 rooms, casino and golf course and will open in 2008. 4.1 Market Segmentation Our customers can be broadly divided into two groups: • Business Travelers. • Leisure Travelers. Table: Market Analysis Market Analysis Potential Customers Growth 2007 2008 2009 2010 2011 CAGR Business Travelers 15% 81,500 93,725 107,784 123,952 142,545 15.00% Leisure Travelers 15% 28,250 32,488 37,361 42,965 49,410 15.00% Total 15.00% 109,750 126,213 145,145 166,917 191,955 15.00% Market Analysis (Pie) Business Travelers Leisure Travelers Page 4
  • 8. Hotel Jardin 5.0 Strategy and Implementation Summary Hotel Jardin will aggresively market both businees and leisure visitors of the Santiago area. Our customers are looking for a different lodging experience that cannot be found in any of the other hotels. We will offer a comfortable , congenial enviroment that will assure return visits to the Hotel Jardin. The lodge will cost less and we will offer our customers all the services they need to make their stay memorable. We will offer two restaurants and 24 hrs room sevice.There will be a gift shop that will be able to to take special orders daily. Each evening, guests can gather in the roof restaurant where there is large fireplace, drinks and light music. 5.1 Competitive Edge The competitive edge of Hotel jardin is its location and. Being located in los Jardines Metropolitanos, next to the Hotel & Casino Gran Almirante and near to the 12th ST district. Simply close to everywhere. 5.2 Marketing Strategy The Hotel Jardin will habve its own website, web company partners and an effective advertising /promotion program that promotes the facility. In addition , Hotel Jardin will be highlighted in Magazines and TV shows. 5.3 Sales Strategy Hotel Jardin will sell rooms directly to repeat customers, as well as via traditional agents and through the internet. Repeat customers will have the privilege of priority reservations during the seasons. We will list Hotel Jardin on www.worldres.com, and other web pages and of course thru our own page www.grydozhotels.com, which will make it available to millions of international; prospects. Room rates for lodge will range from $ 125 - 65 per night. 5.3.1 Sales Forecast The following is the sales forecast for three years Page 5
  • 9. Hotel Jardin Sales Monthly (Planned) $100,000 $90,000 $80,000 $70,000 $60,000 Rooms $50,000 Foood + Drinks $40,000 Other $30,000 $20,000 $10,000 $0 Jul Ago Sep Oct Nov Dic Ene Feb Mar Abr May Jun Sales by Year (Planned) $1,600,000 $1,400,000 $1,200,000 $1,000,000 Rooms $800,000 Foood + Drinks $600,000 Other $400,000 $200,000 $0 2008 2009 2010 Table: Sales Forecast (Planned) Sales Forecast Sales 2008 2009 2010 Rooms $844,594 $971,283 $1,116,976 Foood + Drinks $236,487 $271,960 $312,754 Other $28,650 $32,948 $37,890 Total Sales $1,109,731 $1,276,191 $1,467,619 Direct Cost of Sales 2008 2009 2010 Rooms $0 $0 $0 Foood + Drinks $115,876 $133,257 $153,246 Other $14,400 $16,560 $19,044 Subtotal Direct Cost of Sales $130,276 $149,817 $172,290 Page 6
  • 10. Hotel Jardin 6.0 Management Summary GryDoz Hotels will look for great individuals with a lot of experience and remarkable reputatation in the market. 6.1 Personnel Plan The personnel needed for the Hotel Jardin are the following: • Manager • Assistant Manager • Lodge Staff (12) • Office (4) • Restaurants Staff (22) • Gift Shop (3) • Maintance Staff (4) • Cleaning Staff (12) Table: Personnel (Planned) Personnel Plan 2008 2009 2010 Manager $54,000 $65,000 $71,500 Assistant Manager $20,250 $39,000 $42,900 Lodge Staff $48,600 $60,840 $66,924 Office Staff $32,400 $39,000 $42,900 Restaurants Staff $71,550 $106,600 $117,260 Gift Shop Staff $9,535 $9,230 $10,153 Maintance Staff $33,125 $34,450 $37,895 Cleaning Staff $27,500 $30,250 $33,275 Total Payroll $296,960 $384,370 $422,807 Total People 63 63 63 Payroll Burden $44,544 $57,656 $63,421 Total Payroll Expenditures $341,504 $442,026 $486,228 Table: Sales Forecast (Planned) Sales Forecast Sales 2008 2009 2010 Rooms $844,594 $971,283 $1,116,976 Foood + Drinks $236,487 $271,960 $312,754 Other $28,650 $32,948 $37,890 Total Sales $1,109,731 $1,276,191 $1,467,619 Direct Cost of Sales 2008 2009 2010 Rooms $0 $0 $0 Foood + Drinks $115,876 $133,257 $153,246 Other $14,400 $16,560 $19,044 Subtotal Direct Cost of Sales $130,276 $149,817 $172,290 7.0 Financial Plan The following is the financial plan for the Hotel Jardin. Page 7
  • 11. Hotel Jardin 7.1 Important Assumptions Table: General Assumptions General Assumptions 2008 2009 2010 Short-term Interest Rate % 10.00% 10.00% 10.00% Long-term Interest Rate % 10.00% 10.00% 10.00% Tax Rate % 30.00% 30.00% 30.00% Expenses in Cash % 10.00% 10.00% 10.00% Personnel Burden % 15.00% 15.00% 15.00% 7.2 Break-even Analysis The monthly break-even point is $ 71,307. Table: Break-even Analysis Break-even Analysis: Monthly Units Break-even 705 Monthly Sales Break-even $71,307 Assumptions: Average Per-Unit Revenue $101.11 Average Per-Unit Variable Cost $27.15 Estimated Monthly Fixed Cost $52,160 Break-even Analysis $40,000 $20,000 $0 ($20,000) ($40,000) ($60,000) $0 $20,222 $40,444 $60,666 $80,888 $101,110 Monthly break-even point Break-even point = where line intersects with 0 7.3 Projected Profit and Loss Page 8
  • 12. Hotel Jardin Table: Profit and Loss (Planned) Pro Forma Profit and Loss 2008 2009 2010 Sales $1,109,731 $1,276,191 $1,467,619 Direct Cost of Sales $130,276 $149,817 $172,290 Other Production Expenses $0 $0 $0 ------------ ------------ ------------ Total Cost of Sales $130,276 $149,817 $172,290 Gross Margin $979,455 $1,126,374 $1,295,330 Gross Margin % 88.26% 88.26% 88.26% Operating Expenses: Advertising/Promotion $68,250 $78,488 $90,261 Travel $0 $0 $0 Miscellaneous $0 $0 $0 Payroll Expense $296,960 $384,370 $422,807 Payroll Burden $44,544 $57,656 $63,421 Depreciation $0 $0 $0 Leased Equipment $0 $0 $0 Utilities $74,750 $82,225 $90,448 Insurance $0 $0 $0 Rent $384,000 $384,000 $384,000 Contract/Consultants $0 $0 $0 ------------ ------------ ------------ Total Operating Expenses $868,504 $986,738 $1,050,936 Profit Before Interest and Taxes $110,951 $139,636 $244,394 Interest Expense Short-term $50,000 $50,000 $50,000 Interest Expense Long-term $0 $0 $0 Taxes Incurred $18,285 $26,891 $58,318 Extraordinary Items $0 $0 $0 Net Profit $42,666 $62,745 $136,075 Net Profit/Sales 3.84% 4.92% 9.27% Profit Monthly (Planned) $15,000 $10,000 $5,000 $0 ($5,000) ($10,000) ($15,000) ($20,000) ($25,000) Jul Ago Sep Oct Nov Dic Ene Feb Mar Abr May Jun Page 9
  • 13. Hotel Jardin Profit Yearly (Planned) $140,000 $120,000 $100,000 $80,000 $60,000 $40,000 $20,000 $0 2008 2009 2010 Gross Margin Monthly (Planned) $90,000 $80,000 $70,000 $60,000 $50,000 $40,000 $30,000 $20,000 $10,000 $0 Jul Ago Sep Oct Nov Dic Ene Feb Mar Abr May Jun Page 10
  • 14. Hotel Jardin Gross Margin Yearly (Planned) $1,400,000 $1,200,000 $1,000,000 $800,000 $600,000 $400,000 $200,000 $0 2008 2009 2010 7.4 Projected Cash Flow Table: Cash Flow (Planned) Pro Forma Cash Flow 2008 2009 2010 Cash Received Cash from Operations: Cash Sales $1,109,731 $1,276,191 $1,467,619 From Receivables $0 $0 $0 Subtotal Cash from Operations $1,109,731 $1,276,191 $1,467,619 Additional Cash Received Extraordinary Items $0 $0 $0 Sales Tax, VAT, HST/GST Received $0 $0 $0 New Current Borrowing $0 $0 $0 New Other Liabilities (interest-free) $0 $0 $0 New Long-term Liabilities $0 $0 $0 Sales of other Short-term Assets $0 $0 $0 Sales of Long-term Assets $0 $0 $0 New Investment Received $0 $0 $0 Subtotal Cash Received $1,109,731 $1,276,191 $1,467,619 Expenditures 2008 2009 2010 Expenditures from Operations: Cash Spent on Costs and Expenses $72,556 $77,142 $84,532 Wages, Salaries, Payroll Taxes, etc. $341,504 $442,026 $486,228 Payment of Accounts Payable $598,986 $690,864 $755,282 Subtotal Spent on Operations $1,013,046 $1,210,031 $1,326,042 Additional Cash Spent Sales Tax, VAT, HST/GST Paid Out $0 $0 $0 Principal Repayment of Current Borrowing $0 $0 $0 Other Liabilities Principal Repayment $0 $0 $0 Long-term Liabilities Principal Repayment $0 $0 $0 Purchase Other Short-term Assets $0 $0 $0 Purchase Long-term Assets $0 $0 $0 Dividends $0 $0 $0 Adjustment for Assets Purchased on Credit $0 $0 $0 Subtotal Cash Spent $1,013,046 $1,210,031 $1,326,042 Net Cash Flow $96,685 $66,159 $141,577 Page 11
  • 15. Hotel Jardin Cash Balance $160,785 $226,945 $368,522 Cash (Planned) $200,000 $150,000 $100,000 Net Cash Flow $50,000 Cash Balance $0 ($50,000) Jul Ago Sep Oct Nov Dic Ene Feb Mar Abr May Jun 7.5 Projected Balance Sheet Table: Balance Sheet (Planned) Pro Forma Balance Sheet Assets Short-term Assets 2008 2009 2010 Cash $160,785 $226,945 $368,522 Other Short-term Assets $0 $0 $0 Total Short-term Assets $160,785 $226,945 $368,522 Long-term Assets Long-term Assets $0 $0 $0 Accumulated Depreciation $0 $0 $0 Total Long-term Assets $0 $0 $0 Total Assets $160,785 $226,945 $368,522 Liabilities and Capital 2008 2009 2010 Accounts Payable $54,019 $57,434 $62,935 Current Borrowing $500,000 $500,000 $500,000 Other Short-term Liabilities $0 $0 $0 Subtotal Short-term Liabilities $554,019 $557,434 $562,935 Long-term Liabilities $0 $0 $0 Total Liabilities $554,019 $557,434 $562,935 Paid-in Capital $0 $0 $0 Retained Earnings ($435,900) ($393,234) ($330,489) Earnings $42,666 $62,745 $136,075 Total Capital ($393,234) ($330,489) ($194,414) Total Liabilities and Capital $160,785 $226,945 $368,522 Net Worth ($393,234) ($330,489) ($194,414) Page 12
  • 16. Appendix Appendix Table: Sales Forecast (Planned) Sales Forecast Sales Jul Ago Sep Oct Nov Dic Ene Feb Mar Abr May Jun Rooms $37,538 $75,075 $75,075 $75,075 $75,075 $56,306 $75,075 $75,075 $75,075 $75,075 $75,075 $75,075 Foood + Drinks $10,511 $21,021 $21,021 $21,021 $21,021 $15,766 $21,021 $21,021 $21,021 $21,021 $21,021 $21,021 Other $1,250 $2,500 $2,500 $2,500 $2,500 $2,400 $2,500 $2,500 $2,500 $2,500 $2,500 $2,500 Total Sales $49,299 $98,596 $98,596 $98,596 $98,596 $74,472 $98,596 $98,596 $98,596 $98,596 $98,596 $98,596 Direct Cost of Sales Jul Ago Sep Oct Nov Dic Ene Feb Mar Abr May Jun Rooms $0 $0 $0 $0 $0 $0 $0 $0 $0 $0 $0 $0 Foood + Drinks $5,150 $10,300 $10,300 $10,300 $10,300 $7,725 $10,300 $10,300 $10,300 $10,300 $10,300 $10,300 Other $750 $1,250 $1,250 $1,250 $1,250 $1,200 $1,250 $1,250 $1,250 $1,200 $1,250 $1,250 Subtotal Direct Cost of Sales $5,900 $11,550 $11,550 $11,550 $11,550 $8,925 $11,550 $11,550 $11,550 $11,500 $11,550 $11,550 Page 1
  • 17. Appendix Appendix Table: Personnel (Planned) Personnel Plan Jul Ago Sep Oct Nov Dic Ene Feb Mar Abr May Jun Manager $2,000 $4,000 $4,000 $4,000 $4,000 $8,000 $4,000 $4,000 $4,000 $8,000 $4,000 $4,000 Assistant Manager $750 $1,500 $1,500 $1,500 $1,500 $3,000 $1,500 $1,500 $1,500 $3,000 $1,500 $1,500 Lodge Staff $1,800 $3,600 $3,600 $3,600 $3,600 $7,200 $3,600 $3,600 $3,600 $7,200 $3,600 $3,600 Office Staff $1,200 $2,400 $2,400 $2,400 $2,400 $4,800 $2,400 $2,400 $2,400 $4,800 $2,400 $2,400 Restaurants Staff $2,650 $5,300 $5,300 $5,300 $5,300 $10,600 $5,300 $5,300 $5,300 $10,600 $5,300 $5,300 Gift Shop Staff $305 $710 $710 $710 $710 $1,420 $710 $710 $710 $1,420 $710 $710 Maintance Staff $1,325 $2,650 $2,650 $2,650 $2,650 $5,300 $2,650 $2,650 $2,650 $2,650 $2,650 $2,650 Cleaning Staff $1,100 $2,200 $2,200 $2,200 $2,200 $4,400 $2,200 $2,200 $2,200 $2,200 $2,200 $2,200 Total Payroll $11,130 $22,360 $22,360 $22,360 $22,360 $44,720 $22,360 $22,360 $22,360 $39,870 $22,360 $22,360 Total People 0 0 0 0 63 63 63 63 63 63 63 63 Payroll Burden $1,670 $3,354 $3,354 $3,354 $3,354 $6,708 $3,354 $3,354 $3,354 $5,981 $3,354 $3,354 Total Payroll Expenditures $12,800 $25,714 $25,714 $25,714 $25,714 $51,428 $25,714 $25,714 $25,714 $45,851 $25,714 $25,714 Page 2
  • 18. Appendix Appendix Table: Sales Forecast (Planned) Sales Forecast Sales Jul Ago Sep Oct Nov Dic Ene Feb Mar Abr May Jun Rooms $37,538 $75,075 $75,075 $75,075 $75,075 $56,306 $75,075 $75,075 $75,075 $75,075 $75,075 $75,075 Foood + Drinks $10,511 $21,021 $21,021 $21,021 $21,021 $15,766 $21,021 $21,021 $21,021 $21,021 $21,021 $21,021 Other $1,250 $2,500 $2,500 $2,500 $2,500 $2,400 $2,500 $2,500 $2,500 $2,500 $2,500 $2,500 Total Sales $49,299 $98,596 $98,596 $98,596 $98,596 $74,472 $98,596 $98,596 $98,596 $98,596 $98,596 $98,596 Direct Cost of Sales Jul Ago Sep Oct Nov Dic Ene Feb Mar Abr May Jun Rooms $0 $0 $0 $0 $0 $0 $0 $0 $0 $0 $0 $0 Foood + Drinks $5,150 $10,300 $10,300 $10,300 $10,300 $7,725 $10,300 $10,300 $10,300 $10,300 $10,300 $10,300 Other $750 $1,250 $1,250 $1,250 $1,250 $1,200 $1,250 $1,250 $1,250 $1,200 $1,250 $1,250 Subtotal Direct Cost of Sales $5,900 $11,550 $11,550 $11,550 $11,550 $8,925 $11,550 $11,550 $11,550 $11,500 $11,550 $11,550 Page 3
  • 19. Appendix Appendix Table: General Assumptions General Assumptions Jul Ago Sep Oct Nov Dic Ene Feb Mar Abr May Jun Short-term Interest Rate % 10.00% 10.00% 10.00% 10.00% 10.00% 10.00% 10.00% 10.00% 10.00% 10.00% 10.00% 10.00% Long-term Interest Rate % 10.00% 10.00% 10.00% 10.00% 10.00% 10.00% 10.00% 10.00% 10.00% 10.00% 10.00% 10.00% Tax Rate % 30.00% 30.00% 30.00% 30.00% 30.00% 30.00% 30.00% 30.00% 30.00% 30.00% 30.00% 30.00% Expenses in Cash % 10.00% 10.00% 10.00% 10.00% 10.00% 10.00% 10.00% 10.00% 10.00% 10.00% 10.00% 10.00% Personnel Burden % 15.00% 15.00% 15.00% 15.00% 15.00% 15.00% 15.00% 15.00% 15.00% 15.00% 15.00% 15.00% Page 4
  • 20. Appendix Appendix Table: Profit and Loss (Planned) Pro Forma Profit and Loss Jul Ago Sep Oct Nov Dic Ene Feb Mar Abr May Jun Sales $49,299 $98,596 $98,596 $98,596 $98,596 $74,472 $98,596 $98,596 $98,596 $98,596 $98,596 $98,596 Direct Cost of Sales $5,900 $11,550 $11,550 $11,550 $11,550 $8,925 $11,550 $11,550 $11,550 $11,500 $11,550 $11,550 Other Production Expenses $0 $0 $0 $0 $0 $0 $0 $0 $0 $0 $0 $0 ------------ ------------ ------------ ------------ ------------ ------------ ------------ ------------ ------------ ------------ ------------ ------------ Total Cost of Sales $5,900 $11,550 $11,550 $11,550 $11,550 $8,925 $11,550 $11,550 $11,550 $11,500 $11,550 $11,550 Gross Margin $43,399 $87,046 $87,046 $87,046 $87,046 $65,547 $87,046 $87,046 $87,046 $87,096 $87,046 $87,046 Gross Margin % 88.03% 88.29% 88.29% 88.29% 88.29% 88.02% 88.29% 88.29% 88.29% 88.34% 88.29% 88.29% Operating Expenses: Advertising/Promotion $13,000 $13,000 $13,000 $3,250 $3,250 $3,250 $3,250 $3,250 $3,250 $3,250 $3,250 $3,250 Travel $0 $0 $0 $0 $0 $0 $0 $0 $0 $0 $0 $0 Miscellaneous $0 $0 $0 $0 $0 $0 $0 $0 $0 $0 $0 $0 Payroll Expense $11,130 $22,360 $22,360 $22,360 $22,360 $44,720 $22,360 $22,360 $22,360 $39,870 $22,360 $22,360 Payroll Burden $1,670 $3,354 $3,354 $3,354 $3,354 $6,708 $3,354 $3,354 $3,354 $5,981 $3,354 $3,354 Depreciation $0 $0 $0 $0 $0 $0 $0 $0 $0 $0 $0 $0 Leased Equipment $0 $0 $0 $0 $0 $0 $0 $0 $0 $0 $0 $0 Utilities $3,250 $6,500 $6,500 $6,500 $6,500 $6,500 $6,500 $6,500 $6,500 $6,500 $6,500 $6,500 Insurance $0 $0 $0 $0 $0 $0 $0 $0 $0 $0 $0 $0 Rent $32,000 $32,000 $32,000 $32,000 $32,000 $32,000 $32,000 $32,000 $32,000 $32,000 $32,000 $32,000 Contract/Consultants $0 $0 $0 $0 $0 $0 $0 $0 $0 $0 $0 $0 ------------ ------------ ------------ ------------ ------------ ------------ ------------ ------------ ------------ ------------ ------------ ------------ Total Operating Expenses $61,050 $77,214 $77,214 $67,464 $67,464 $93,178 $67,464 $67,464 $67,464 $87,601 $67,464 $67,464 Profit Before Interest and Taxes ($17,651) $9,832 $9,832 $19,582 $19,582 ($27,631) $19,582 $19,582 $19,582 ($505) $19,582 $19,582 Interest Expense Short-term $4,167 $4,167 $4,167 $4,167 $4,167 $4,167 $4,167 $4,167 $4,167 $4,167 $4,167 $4,167 Interest Expense Long-term $0 $0 $0 $0 $0 $0 $0 $0 $0 $0 $0 $0 Taxes Incurred ($6,545) $1,700 $1,700 $4,625 $4,625 ($9,539) $4,625 $4,625 $4,625 ($1,401) $4,625 $4,625 Extraordinary Items $0 $0 $0 $0 $0 $0 $0 $0 $0 $0 $0 $0 Net Profit ($15,272) $3,966 $3,966 $10,791 $10,791 ($22,259) $10,791 $10,791 $10,791 ($3,270) $10,791 $10,791 Net Profit/Sales -30.98% 4.02% 4.02% 10.94% 10.94% -29.89% 10.94% 10.94% 10.94% -3.32% 10.94% 10.94% Page 5
  • 21. Appendix Appendix Table: Cash Flow (Planned) Pro Forma Cash Flow Jul Ago Sep Oct Nov Dic Ene Feb Mar Abr May Jun Cash Received Cash from Operations: Cash Sales $49,299 $98,596 $98,596 $98,596 $98,596 $74,472 $98,596 $98,596 $98,596 $98,596 $98,596 $98,596 From Receivables $0 $0 $0 $0 $0 $0 $0 $0 $0 $0 $0 $0 Subtotal Cash from Operations $49,299 $98,596 $98,596 $98,596 $98,596 $74,472 $98,596 $98,596 $98,596 $98,596 $98,596 $98,596 Additional Cash Received Extraordinary Items $0 $0 $0 $0 $0 $0 $0 $0 $0 $0 $0 $0 Sales Tax, VAT, HST/GST Received 0.00% $0 $0 $0 $0 $0 $0 $0 $0 $0 $0 $0 $0 New Current Borrowing $0 $0 $0 $0 $0 $0 $0 $0 $0 $0 $0 $0 New Other Liabilities (interest-free) $0 $0 $0 $0 $0 $0 $0 $0 $0 $0 $0 $0 New Long-term Liabilities $0 $0 $0 $0 $0 $0 $0 $0 $0 $0 $0 $0 Sales of other Short-term Assets $0 $0 $0 $0 $0 $0 $0 $0 $0 $0 $0 $0 Sales of Long-term Assets $0 $0 $0 $0 $0 $0 $0 $0 $0 $0 $0 $0 New Investment Received $0 $0 $0 $0 $0 $0 $0 $0 $0 $0 $0 $0 Subtotal Cash Received $49,299 $98,596 $98,596 $98,596 $98,596 $74,472 $98,596 $98,596 $98,596 $98,596 $98,596 $98,596 Expenditures Jul Ago Sep Oct Nov Dic Ene Feb Mar Abr May Jun Expenditures from Operations: Cash Spent on Costs and Expenses $5,177 $6,892 $6,892 $6,209 $6,209 $4,530 $6,209 $6,209 $6,209 $5,602 $6,209 $6,209 Wages, Salaries, Payroll Taxes, etc. $12,800 $25,714 $25,714 $25,714 $25,714 $51,428 $25,714 $25,714 $25,714 $45,851 $25,714 $25,714 Payment of Accounts Payable $1,553 $47,109 $62,025 $61,820 $55,882 $55,378 $41,276 $55,882 $55,882 $55,700 $50,596 $55,882 Subtotal Spent on Operations $19,530 $79,714 $94,630 $93,743 $87,805 $111,337 $73,199 $87,805 $87,805 $107,152 $82,519 $87,805 Additional Cash Spent Sales Tax, VAT, HST/GST Paid Out $0 $0 $0 $0 $0 $0 $0 $0 $0 $0 $0 $0 Principal Repayment of Current Borrowing $0 $0 $0 $0 $0 $0 $0 $0 $0 $0 $0 $0 Other Liabilities Principal Repayment $0 $0 $0 $0 $0 $0 $0 $0 $0 $0 $0 $0 Long-term Liabilities Principal Repayment $0 $0 $0 $0 $0 $0 $0 $0 $0 $0 $0 $0 Purchase Other Short-term Assets $0 $0 $0 $0 $0 $0 $0 $0 $0 $0 $0 $0 Purchase Long-term Assets $0 $0 $0 $0 $0 $0 $0 $0 $0 $0 $0 $0 Dividends $0 $0 $0 $0 $0 $0 $0 $0 $0 $0 $0 $0 Adjustment for Assets Purchased on Credit $0 $0 $0 $0 $0 $0 $0 $0 $0 $0 $0 $0 Subtotal Cash Spent $19,530 $79,714 $94,630 $93,743 $87,805 $111,337 $73,199 $87,805 $87,805 $107,152 $82,519 $87,805 Net Cash Flow $29,769 $18,882 $3,966 $4,853 $10,791 ($36,865) $25,397 $10,791 $10,791 ($8,556) $16,077 $10,791 Cash Balance $93,869 $112,751 $116,717 $121,570 $132,360 $95,496 $120,892 $131,683 $142,474 $133,918 $149,995 $160,785 Page 6
  • 22. Appendix Appendix Table: Balance Sheet (Planned) Pro Forma Balance Sheet Assets Short-term Assets Starting Balances Jul Ago Sep Oct Nov Dic Ene Feb Mar Abr May Jun Cash $64,100 $93,869 $112,751 $116,717 $121,570 $132,360 $95,496 $120,892 $131,683 $142,474 $133,918 $149,995 $160,785 Other Short-term Assets $0 $0 $0 $0 $0 $0 $0 $0 $0 $0 $0 $0 $0 Total Short-term Assets $64,100 $93,869 $112,751 $116,717 $121,570 $132,360 $95,496 $120,892 $131,683 $142,474 $133,918 $149,995 $160,785 Long-term Assets Long-term Assets $0 $0 $0 $0 $0 $0 $0 $0 $0 $0 $0 $0 $0 Accumulated Depreciation $0 $0 $0 $0 $0 $0 $0 $0 $0 $0 $0 $0 $0 Total Long-term Assets $0 $0 $0 $0 $0 $0 $0 $0 $0 $0 $0 $0 $0 Total Assets $64,100 $93,869 $112,751 $116,717 $121,570 $132,360 $95,496 $120,892 $131,683 $142,474 $133,918 $149,995 $160,785 Liabilities and Capital Jul Ago Sep Oct Nov Dic Ene Feb Mar Abr May Jun Accounts Payable $0 $45,041 $59,957 $59,957 $54,019 $54,019 $39,413 $54,019 $54,019 $54,019 $48,734 $54,019 $54,019 Current Borrowing $500,000 $500,000 $500,000 $500,000 $500,000 $500,000 $500,000 $500,000 $500,000 $500,000 $500,000 $500,000 $500,000 Other Short-term Liabilities $0 $0 $0 $0 $0 $0 $0 $0 $0 $0 $0 $0 $0 Subtotal Short-term Liabilities $500,000 $545,041 $559,957 $559,957 $554,019 $554,019 $539,413 $554,019 $554,019 $554,019 $548,734 $554,019 $554,019 Long-term Liabilities $0 $0 $0 $0 $0 $0 $0 $0 $0 $0 $0 $0 $0 Total Liabilities $500,000 $545,041 $559,957 $559,957 $554,019 $554,019 $539,413 $554,019 $554,019 $554,019 $548,734 $554,019 $554,019 Paid-in Capital $0 $0 $0 $0 $0 $0 $0 $0 $0 $0 $0 $0 $0 Retained Earnings ($435,900) ($435,900) ($435,900) ($435,900) ($435,900) ($435,900) ($435,900) ($435,900) ($435,900) ($435,900) ($435,900) ($435,900) ($435,900) Earnings $0 ($15,272) ($11,306) ($7,341) $3,450 $14,241 ($8,018) $2,773 $13,564 $24,355 $21,084 $31,875 $42,666 Total Capital ($435,900) ($451,172) ($447,206) ($443,241) ($432,450) ($421,659) ($443,918) ($433,127) ($422,336) ($411,545) ($414,816) ($404,025) ($393,234) Total Liabilities and Capital $64,100 $93,869 $112,751 $116,717 $121,570 $132,360 $95,496 $120,892 $131,683 $142,474 $133,918 $149,995 $160,785 Net Worth ($435,900) ($451,172) ($447,206) ($443,241) ($432,450) ($421,659) ($443,918) ($433,127) ($422,336) ($411,545) ($414,816) ($404,025) ($393,234) Page 7