SlideShare uma empresa Scribd logo
1 de 81
INTRODUCTION

                                         CHAPTER-1

Attitude:
            The importance of attitude in understanding psychological phenomenon was given
formal recognition early in the history of social psychology. From the time of the concept‟s entry
in to the language of psychology until now, interest in attitude has been strong and growing.
However, over the years attitudes have been studied with differing emphasis and methods.

Concept of Attitude:
              It is necessary to be precise in defining attitudes, because the variety of published
definitions and descriptions is almost endless. Like any other concept, attitude may also be
defined in two ways, Conceptual and Operational. There is quite a difference in the conceptual
definition of the term attitude, and divergent points of view regarding the concept of attitude
have developed.


Major aspects:
               When the term first entered the field of social phenomenon, it was natural to
conceive of attitude as a tendency, set or readiness to respond to some social object. For the first
time, ALLPORT noted the definition of attitude, which he had observed contained the words
„readiness‟, „set‟ or „disposition to act‟. Even ALLPORT has used these terms in defining
attitude.


He defines attitude as follows:
“Attitude is a mental and neural state of readiness organized through experience,
Exerting a directive or dynamic influence upon the individual‟s response to all
Objects and situations with which it is related”
                                                   1
Features of Attitude:


     Attitudes affect behavior of an individual by putting him ready to respond favorably to
        things in his environment.

     Attitudes are acquired through learning over a period of time. The process of learning
        attitudes starts right from the childhood and continues throughout the life of a person.

     Attitudes are invisible as they constitute a psychologies phenomenon which cannot be
        observed directly. They can be observed by observing the behavior of an individual.

     Attitudes are pervasive and every individual has some kind of attitude towards the objects
        in his environment. In fact, attitudes are forced in       the socialization process and may
        relate to anything in the environment.

Attitude, Opinion and Belief:
              An opinion is generally the expression of one‟s judgment of a particular set of
facts, an evaluation of the circumstances presented to him. “Thurstone” defines opinion „as a
response to a specifically limited stimulus, but the response is certainly influenced by the
predisposition with, with the individuals operating, that is, the attitude structure. A difference
can also be made between attitude and belief. A belief is an enduring organization of perceptions
and cognitions about some aspects of individual world. Thus, belief is a hypothesis concerning
the nature of objects, more particularly, concerning one‟s judgments of the probability regarding
the nature. In this sense, belief is the cognitive component of attitude which reflects the manner
in which an object is perceived. The difference between attitude, opinion, and belief exists on
conceptual basis Most researchers believe that these three terms are so closely tied that it is
difficult to separate them except on a limited conceptual basis.


                                                 2
In the literature, often, there is a considerable amount of overlapping in these three terms.
Most psychologists, however, believe that attitudes are more fundamental to human behavior
than are he related aspects. For this reason, more attempts have been made to analyze attitudes as
compared to others. Obviously attitudes are an important consideration because of their central
position in the process of transforming work requirements in to efforts.

       Attitude alone do not influence behavior but these acts with other factors in the individual
influencing behavior, such as personality, perception, motivation, etc. Further, attitudes are also
affected by the individual dimension as well as the objects, persons, and ideas. Attitudes have
been through as serving four functions and there by influencing the behavior. These are
instrumental, ego defensive, value orientation and knowledge.

   1. Instrumental: Attitudes serve as a means to reach a desired goal or to avoid an
       undesired one. Instrumental attitude are aroused by the activation of a need or cues that
       are associated with the attitude object and arouse favorable or unfavorable feelings.

   2. Ego-Defensive: The ego-defensive functions of attitude acknowledge their importance
       of psychological thought. Attitude may be acquired by facing threats in the external
       world or becoming aware of his own unacceptable impulses.

   3. Value Orientation: The value-orientation function takes in to account attitudes that
       are held because they express a person‟s self-image, or by cues that engage the person‟s
       values and make them salient to him.

   4. Knowledge: The knowledge function of attitude is based on a person‟s need to
       maintain a stable, organized and meaningful structure of the world.


   5. Attitude that provides a standard against which a person evaluates the aspects of his
       world and serve as the knowledge function too.


                                                 3
These functions of attitudes affect the individual‟s way of interpreting the information
coming to him. Since attitudes intervene between work requirements and work responses,
information about how people feel about their jobs can be quite useful in the predication about
work response. Thus, these types of attitudes can portray areas of investigation for making the
individual and the organization more compatible.

Factors in Attitude Formation:
       The attitudes are learned. Though there are different approaches as how learning works
and is acquired by an individual, generally it is held that individuals learn things from the
environment in which they interact. Thus, for attitude formation, all these factors must be taken
in to account from which people learn. Such factors may be analyzed in terms of groups starting
from the family as a group, an individual moves in a close group, then to longer groups, and
finally to the society as a whole. A part from these groups, the individual‟s psychology which
makes up particularly his personality, is also responsible for behavior and attitudes.

Methods of Attitude Change:
     There are various methods through which a positive change in attitudes may be brought. In
the social context, Cohen has suggested four methods for attitude change. They are:
     Communication of additional information.

     Approval and disapproval of a particular attitude.

     Group influence, and

     Inducing engagement in discrepant behavior.

    In some or the other, all these methods involve introducing discrepancies among the
elements making up the individual‟s attitudes in the hope that the elements will be rebalanced
through the effective component of the attitudes. From the organization point of view, a Manager
can take following actions in brining change in attitudes of its organizational members.


                                                 4
 Group action

       Persuasion through leadership

       Persuasion through communication and

       Influence of total situation.

These actions involve the analysis of different variables affecting a particular action.

Values and Attitudes:
         Some researchers see values as consisting of large sets of related attitudes. For example,
“Fishbein” and “Ajzen” have included two components in attitudes-informational, emotional.
Thus, they have taken values as a part of attitudes. However, some differences exist between
values and attitudes. Attitudes are specific and related to distinct objects; people, or ideas. Values
are more general than attitudes; values often contain statement of goodness or badness associated
with the attitudes which people hold. Values are, then, beliefs about which attitudes we should
have or how we should behave.


Values and Behaviour:

   Behaviour of people is influenced by the        values which they hold, particularly in terms of
those stimuli which have some value orientation in the organizational context, understanding the
influence of individual value system on the behaviour of individuals in the following manner:

    Values influence an individual perception about the problems he faces and consequently
       the decision he makes to overcome those problems.

    Values influences the way in which an individual looks at the other individual and groups
       of individuals, that is, interpersonal relationship. Values become the basis of such
       interpersonal relationship interactions.


                                                  5
 Individuals judge organizational success as well as its achievement of the basis of their
       value system. Thus, for some individuals, organizational success may be in the form of
       high profit earning irrespective of the means adopted whereas, this may be a mean thing
       for other individuals.

    Individuals set limit for the determination of what is ethical or unethical behaviour for
       themselves as well as for the others.

    Values determine the extent to which individuals accept organizational pressures and
       goals. If these do not match with the value held by them, they thwart the organizational
       pressures and goals, and even leave the organization.

Employees’ Attitudes towards the Organization:
        Attitudes are not the same as values, but the two are interrelated. You can see this by
looking at the three components of an attitude: cognition, affect and behavior. The belief that
“discrimination is wrong” is a value statement.

Cognitive Component of an Attitude:
       It sets the stage for the more critical part of an attitude and is reflected in the evaluative
statements concerning objects, people or events. The behavioral component of an attitude refers
to an intention to behave in a certain way towards someone or something. In organizations,
attitudes are important because they affect job behaviour. If workers believe, for example, that
superiors, auditors, bosses, and time-and motion engineers are all in conspiracy to make
employees work harder for the same or less money, and then it makes sense to try to understand
how these attitudes were formed, their relationship to actual job behaviour, and how they might
be changed.


                                                  6
Types of Attitudes:

        A person can have thousands of attitudes, but Organizational Behaviour focuses our
attention on a very limited number of work-related attitudes. These work-related attitudes tap
positive or negative evaluations that employees hold about aspects of their work environment.
Most of the research in OB has been concerned with three attitudes: job satisfaction, job
involvement, and organizational commitment.


Job Satisfaction:

       The term job satisfaction to an individual‟s general attitude towards his or her job. A
person with a high level of job satisfaction holds positive attitudes about their job, while a person
who is dissatisfied with his or her job holds negative attitudes about the job. When people speak
of employee attitudes, more often mean job satisfaction.

Job Involvement:

       The term job involvement is a more recent addition to the OB literature while there isn‟t
complete agreement over what the tem means. A workable definition states that job involvement
measures the degree to which a person identifies him with his or her job and considers his or her
perceived performance level important to self-worth. Employees with a high level of job
involvement strongly identify with and really care about the kind of work they do.

Organizational Commitment:

       The third job attitude is organizational commitment, which is defined as a state in which
an employee identifies with a particular organization and its goals, and wishes to maintain
membership in the organization. So, high job involvement means identifying with one‟s specific
job, while high organizational commitment means identifying with one‟s employing
organization.


                                                 7
Attitudes and Consistency:

        Research has generally concluded that people seek consistency among their attitudes and
between their attitudes and their behaviour. This means that individuals seek to reconcile
divergent attitudes and align their attitudes and behaviour so that they appear rational and
consistent. When there is an in consistency, forces are initiated to return the individual to an
equilibrium state.


Cognitive Dissonance Theory:

        This theory sought to explain the linkage between attitudes and behaviour. Dissonance
means an inconsistency. Cognitive dissonance refers to an incompatibility that an individual
might perceive between two or more of his or her attitudes, or between his or her behaviour and
attitudes.

Moderating Variables:

        The most powerful moderates have been found to be the importance of the attitude
specially its accessibility, whether there must exist social pressures, and whether a person has
direct experience with the attitude. Important attitudes are one‟s that reflect fundamental values,
self-interest, or identification with individuals or groups that a person values. Attitude that
individuals consider important tend to show a strong relationship to behavior.


Attitude Survey:

        The preceding review indicates that knowledge of employee attitudes can be helpful to
managers in attempting to predict employee behaviour. But, how does management get
information about employee attitudes. The most popular methods are through the use of attitude
surveys.

                                                8
Attitude and Workforce Diversity:

        Managers are increasingly concerned with changing employee attitude to reflect shifting
perspectives on racial, gender, and other diversity issues. A comment to a co-worker of the
opposite sex, which 20 years ago might have been taken as a complaint, can today become a
career-limiting episode. The majority of large U.S. employees and a substantial proportion of
medium sized and smaller ones sponsor some sort of diversity training. Some examples are,
Police Officers in Escondido, California, receive 36 hours of diversity training for their 12,000
employees. The Federal Aviation‟s Administration sponsors amendatory 8 hours diversity
seminar for employees of its western pacific region.

Job Satisfaction:

        Job satisfaction is one of the important factors which have drawn attention of managers in
the organization as well as academicians Various studies have been conducted to find out the
factors which determine job satisfaction and the way it influences productivity in the
organization. Though, there is no conclusive evidence that job satisfaction affects productivity
directly because productivity depends on so many variables, it is still a prime concern for
managers. Job satisfaction is the mental feeling of favorableness which an individual has about
his job. “Dubrins” has defined job satisfaction in terms of pleasure and contentment when he
says that.

Determinants of Job Satisfaction:

        While analyzing various determinants of job satisfaction, we have to keep in mind that
all individuals do not receive the same degree of satisfaction though they perform the same job in
the same job environment and at the same time. Therefore, it appears that besides the nature of
job and job environment, there are individual variables which affect job satisfaction. Thus all
those factors which provide a fit among individual variables, nature of job and situational
variables determine the degree of job satisfaction. Let us see what these factors are:


                                                 9
Individual Factors:

   Individuals have certain expectation from their jobs. If there expectations are met from the
jobs, they feel satisfied. These expectations are based on an individual‟s level of education, age,
and other factors.

1. Level of Education:

        Level of education of an individual is a factor which determines the degree of job
   satisfaction. For example, several studies have found the negative correlation between the
   level of education, particularly higher level of education and job satisfaction.

2. Age:

        Individuals experience different degrees of job satisfaction at different stages of their
   life. Job satisfaction is high at the initial stage, get gradually reduced, starts rising up to
   certain stage and finally dips to a low degree.

3. Other factors:

       Besides the above two factors, there are other individual factors which affect job
   satisfaction. If an individual does not have favorable social and family life, he may not feel
   happy at the work place. Similarly, other personal problems associated with him may affect
   his level of job satisfaction.

 Effect of his Job Satisfaction:
        Job satisfaction has a variety of effects. The effects may be seen in the context of an
individual‟s physical and mental health, productivity, absenteeism, and turnover.


                                                10
Physical and Mental Health:

       The degree of job satisfaction affects an individual‟s physical and mental health. Since,
job satisfaction is a typed of mental feeling, its favorableness or unfavourableness affects the
individual psychologically which for example, “Lawler” has pointed out that drug abuse,
alcoholism, and mental and physical health results from psychologically harmful jobs.

Improving Job Satisfaction:

        Job satisfaction plays a significant role in the organization. Therefore, Managers should
take concrete steps to improve the level of job satisfaction. These steps may be in the form of job
re-designing to make the job more interesting and challenging, improving quality of work life,
linking rewards with performance, and improving overall organizational climate.

Attitude Measurement:

       Attitudes are subjective attributes of people. They can be regarded as construct in the
sense that they are conceptualizations of human qualities that are formed on the basis of either
rational consideration or     statistical evidence. Thus, people may vary along a number of
attitudinal dimensions.

Keeping this measurement aspect in to consideration, the attitudes might be defined
operationally by describing the measurement systems that psychologists use to measure attitudes.
Attitude measurement, developed largely by social psychologists is concerned with the efforts to
tap these attitudes as they are characteristics of individuals. There are many methods of attitude
measurement. The Thurston type of scaling goes back to the early work of Thurston and Chive,
which collected a large number of statements relating to the area in which attitudes were to be
measured. This statement may be relating to any object about which attitudes were to be
measured. The statements are both favorable and unfavorable and are placed in 11 piles, with
most favorable one being placed in pile 11. Other statements are placed in between their position
depending on the degree of favorability or unfavorability. The scale is then presented to the


                                                11
respondents. Each respondent checks the statement in pulling together numerous methods
dealings with attitude measurement. They are:

    Self-Report

    Indirect Tests

    Direct Observation Techniques

    Psychology Reaction Techniques

However attitude measurement of employees in an organization is most commonly carried out
with self-respect questionnaires uses several scaling methods. There are three types of attitude
scaling which are commonly used in attitude measurement. They are Thurston type of scale,
Liker scale, and semantic differential. With which he agrees his attitude score is then based on
the average or the median scale of the statements that he has checked. Soon after Thurston scale,
Likert experimented with certain other varieties of attitude scales. Likert‟s attitude scale uses five
points. The statements relating to the measurement of attitude is given to the person concerned
and he is asked to check one of the five points given for every statement. These points show the
degree of agreement or disagreement with the statement. The Likert scale is considered better as
compared to Thurston because of several positive facts.

For example, in this scaling, there is no much problem in making numerous statements which
will show both positive and negative degree. The semantic differential, an attitude scaling
technique that lends itself to various applications, was developed by Orgood, Suci and
Tannenbaum. Therefore, an employee who has a high level of job satisfaction tends to bear
attitudes, which are favorable to the organization. Balancing the positives with the negatives is
important so that the employees will not be disappointed and become a problem that would have
been avoided from the beginning. Attitudes cannot be changed drastically or quickly. There is a
reason why people have attitudes; it is a part of them. To change a person takes patience and lots
and lots of stalls, especially in a boss-employee relationship where it is more formal. Sometimes,
all it takes is a warning in simple words which is to change an unfavorable attitude.


                                                 12
When an employee discloses a mental health problem, try to work out a reasonable
accommodation. Give him/her time off from work or a modified work schedule, make physical
changes to the work place, or adjust supervisory instructions or training. Many mental health
problems are highly treatable and cause only temporary disruptions at work. If an employee with
a chronically negative attitude suddenly claims a mental disability, employers have the right to
ask for medical certification and/or, in some situations, a second opinion. However, credible
testimony from a family member may be enough, and asking for more may be an invasion of
privacy. Check with an attorney before requesting these. Strike before the iron gets hot by
including conduct problems in your employee hand book. Develop a policy that clearly
delineates the types of behavior which are not acceptable in your workplace. The above
mentioned examples are some which can change unfavorable attitude to a favorable one.


                                              13
PRISIDENCY KID LEATHER LIMITED

                                COMPANY PROFILE

              This closely held leather company in existence since 1972 consists of a leather
   division, a shoe upper division and a full shoe division. The company derives enormous
   pride and satisfaction from the fact that the customer relationships are everlasting due to
   the consistency maintained in its very high quality standard of leathers, shoe uppers and
   shoes. Elegance and finesse is the hallmark of the glazed kid leathers. Beautifully crafted
   from a variety of leathers, the Shoe Uppers & Shoes are based on detailed information
   gathered from the clients. The company's policy is to understand the requirements of its
   customers accurately and come up with the right product, in the right leather at an
   attractive price. Customer profile of the company includes the best factories in Germany,
   Holland, England, Italy, France, U.S.A and the Far East. The company's management
   board consists of a chairman and 5 directors


  INFRASTRUCTURE
          The state-of-the-art manufacturing facility of PKL is located at a place that is well
connected, and easily accessible. The area is renowned for leather and shoe manufacturing;
hence skilled labour is available in abundance. Captive power and generating sets ensure
uninterrupted production. Modern communication facilities like Internet, E-mail link to all the
manufacturing facilities and Head Office


                                                  14
MANPOWER
       The tannery employs 300 workers and 100 trained technical staff with an annual
production capacity of Fifteen million square feet of Kid, Sheep and Calf Leathers in a built up
area of 16,000 square meters. Renowned for its glazed kid leathers using the best Indian Raw
Material, the Tannery is equipped with a modern Effluent Treatment Plant. The shoe division of
the company employs around 1200 workers, 40 technical personnel, executives and managers to
ensure that quality requirements and delivery schedules are met. The fully automated plant is
managed by highly skilled staff, right from cutting to final production to meet the global demand
of increasingly high standards with an annual manufacturing capacity of 1.2 million pairs of shoe
uppers and 3,00,000 pairs of shoes.


Shoe Upper Division:
       Customer satisfaction is extremely important to us. Hence, we place great emphasis on
research, design and quality to ensure their total satisfaction. We use the best and most
appropriate leathers. Production Capacity: Two units with a total capacity of 12,00,000 pairs a
year making both Ladies and Gents uppers.


Tannery & Finished Leather Division

       The tannery, with an annual production capacity of fifteen million square feet of kid,
sheep and calf leathers in a buildup area of 16,000 square meters, employs 300 workers and
100 trained technical personnel. Renowned for its glazed kid leathers, produced by using the
best Indian raw material, the tannery is equipped with a modern effluent treatment plant.


                                               15
Finished Leather

  1) Kid Leathers: Glazed and Polished Finishes Chrome and Vegetable Re-tanned

  2) Sheep and Lamb Cabrettas

  3) Calf Leathers: Glazed and Polished Leathers


  Full Shoes division

        With constant technical inputs and access to the latest technology our products are in a
class by themselves. Total commitment to quality, service and delivery schedule is to the total
satisfaction of our valued clients. Our exotic collection of leather shoes reflects a
contemporary trend in fashion worldwide. Each one is subtly handcrafted by skilled artisans
and custom-made to impress the most fastidious buyers. Production capacity of 3, 00,000
pairs a year.


                                                16
PRODUCT PROFILE
                                     PKL Leather Industry
       The Presidency kid‟s Limited industry occupies a place of prominence in the Indian
economy in view of its massive potential for employment, growth and exports. There has been
an increasing emphasis on its planned development, aimed at optimum utilization of available
raw materials for maximizing the returns, particularly from exports. The exports of leather and
leather products gained momentum during the past two decades. There has been a phenomenal
growth in exports from Rs.320 million in the year 1965-66 to Rs.69558 million in 1996-97.
Indian leather industry today has attained well merited recognition in international markets
besides occupying a prominent place among the top seven foreign exchange earners of the
country.


       The leather industry has undergone a dramatic transformation from a mere exporter of
raw materials in the sixties to that of value added finished products in the nineties. Policy
initiatives taken by the Government of India since 1973 have been instrumental to such a
transformation. In the wake of globalization of Indian economy supported with liberalized
economic and trade policies since 1991, the industry is poised for further growth to achieve
greater share in the global trade.


       Apart from a significant foreign exchange earner, leather industry has tremendous
potential for employment generation. Direct and indirect employment of the industry is around 2
million. The skilled and semi-skilled workers constitute nearly 50% of the total work force. The
estimated employment in different sectors of leather industry is as follows:


                                                17
Structure of the industry
       The leather industry is spread in different segments, namely, tanning & finishing,
footwear & footwear components, leather garments, leather goods including saddler & harness,
etc. The estimated production capacity in different segments is as under


       Product                                                     Capacity
      Leather
        Hides                                               64 million pieces
        Skins                                                      166 million pieces
  Footwear & Footwear Components
      a) Shoes                                                     100 million pairs

       b) Leather shoe uppers                                      78 million pairs

       c) Non-leather shoes/Chappals etc.                          125 million pairs

Leather Garments                                                   6 million pieces

Leather Products                                                   70 million pieces

Industrial Gloves                                                  40 million pairs

Saddlery                                                            6000 pieces

       The major production centers for leather and leather products are located at Chennai,
Ambur, Ranipet, Vaniyambadi, Trichi, Dindigul in Tamil Nadu, Calcutta in West Bengal,
Kanpur in Uttar Pradesh, Jalandhar in Punjab, Bangalore in Karnataka, Delhi and Hyderabad in
Andhra Pradesh.


                                               18
Raw material supplies
         There exists a large raw material base. This is on account of population of 194 million
cattle, 70 million buffaloes, and 95 million goats. According to the latest census, India ranks first
among the major livestock holding countries in the world. In respect of sheep with 48 million
sheep‟s, it claims the sixth position. These four species provide the basic raw material for the
leather industry.
         The annual availability of 166 million pieces of hides and skins is the main strength of
the industry. This is expected to go up to 218 million pieces by the end of year 2000. Some of the
goat/calf/sheep skins available in India are regarded as specialty products commanding a good
market. Abundance of traditional skills in training, finishing and manufacturing downstream
products and relatively low wage rates are the two other factors of comparative advantage for
India.
Tanning and finishing capacity
         With tanning and finishing capacity for processing 1192 million pieces of hides and skins
per annum spread over different parts of the country, most of which is organized along modern
lives, the capability of India to sustain a much larger industry with its raw material resource is
evident. In order to augment the domestic raw material availability, the Government of India has
allowed duty free import of hides and skins from anywhere in the world. It is an attraction for
any foreign manufacturer who intends to shift his production base from a high cost location to
low cost base.
Export Potential
         The leather industry, one of the major foreign exchange earners of the country recorded
significant growth since the beginning of the decade. Today the share of the value added finished
products in the total exports from leather sector are 80% as against 20% in 1970s.


                                                 19
Top ten Indian leather exporters
Tata International Ltd.
Florind Shoes Ltd.
Punihani International
Farida Shoes Ltd.
Mirza Tanners Ltd.
T. Abdul Wahid & Company
Hindustan Lever Ltd.
Super House Leather Ltd.
RSL Industries Ltd.
Presidency Kid Leather Ltd.


Pkl Leather Footwear Industry
       India is the world's second largest producer of footwear; its production estimated over
700 million pairs per annum. At about US $ 300 million per year, footwear accounts for 18
percent share of total exports of leather exports.

       Various types of shoes produced and exported from India include dress shoes, casuals,
moccasins, sports shoes, horacchis, sandals, ballerinas, and booties. Major production centers are
Chennai (Madras), Delhi, Agra, Kanpur, Mumbai (Bombay), Calcutta and Jalandhar.

       Most of the modern footwear manufacturers in India are already supplying to well
establish brands in Europe and USA. The large domestic market and the opportunity to cater to
world markets make India an attractive destination for technology and investments. Equally
relevant is it for the footwear components industry, at this juncture, it is posed for real growth
and diversification.


                                                 20
PKL Leather Goods Industry
       Items produced by this sector include, in addition to bags, handbags, hand gloves and
industrial gloves, wallets, ruck sacks, folios, brief cases, travel ware, belts, sports goods,
upholstery and saddlery goods.


       A surfeit of modern units in Chennai, Kanpur and Calcutta employing skilled human
resources and equipped with modern and sophisticated machinery account for a diversified range
of superlative small leather goods including bags, purses, wallets, industrial gloves etc. made of
quality leathers of cows, sheep, goats and buffaloes. The products meet the requirement of bulk
buyers and consumers in Europe, USA and Australia. The major market for Indian leather goods
is Germany, with an off take of about 25 per cent of the leather goods produced in India followed
by USA, UK, France and Italy. With products ranging from designer collections to personal
leather accessories, this sector has a share of 20.53 per cent in the leather industry, while
maintaining an average growth rate of 11 per cent recorded in the last five years.


PKL Leather Garments Industry
       The Leather Garment Industry occupies a place of prominence in the Indian leather
sector. The product classification of leather garments comprise of jackets, long coats, waist
coats, shirts, pant/short, children garments, motorbike jackets, aprons and industrial leather
garments.

       Indian leather garments, which entered the world market only in the mid-eighties with
exports of Rs. 15 crores in 1997-98, account for about Rs. 1530 crore in 1997-98. The major
export destination of leather garments from India is Germany. In 1997, German imports of
leather garments aggregated DM 1786 million of which DM 304 million worth of imports went
from India. India, China and Turkey were the major suppliers of leather garments for the
German market, as they accounted for about 78% of the market share.


                                                21
Among the three major exporting nations of leather garments, India maintains a similar
level of market share of about 20%, in both German and EU markets.

       Other markets for India include Italy, U.K., U.S.A. France, Spain and Netherlands.
Recently, successful attempt had been made for exports to Denmark, Switzerland and Canada.

PKL Leather Industry - Investment & Sales

       The ratio of investment: sales value is 1: 2.25, which is very low when compared to
other industries. This is mainly due to low capacity utilization of the units. The capacity
utilisation of units in respect of hides converting raw into unfinished leathers is estimated at
49%, raw to finished 60% and unfinished to finished 70%.

       In the case of skin based tanneries, the respective percentages are 64, 67 and
70. The main reasons reported for under utilisation of capacity are raw material shortage, high
price of raw materials, and lack of modernization, financial constraints, power constraints and
stringent environmental regulations.


        Marketing of leather and leather products in Germany & the EU


       The leather sector offers a good potential which Indian entrepreneurs can exploit in
Germany and other EU markets characterised by ever growing competitiveness in terms of price
and quality, on one hand, and the environmental considerations, on the other. With a strong
foothold that the Indian leather industry has had for long in these markets, and its advantage of
raw material and labour resources, Indian leather exporters can, and should, mount a concerted
marketing campaign to wrest a share consistent with their inherent strength and potential. This
has to be done against the background of the well-known salient features of the German market:


                                               22
   The world's second largest import and export market

   A difficult buyers' market with hyper competition and high expectations
   A dynamic multi-faceted market with rapid technological development and innovations A
    market where a considerable amount of buying power is devoted to satisfying individual
    needs
   A market influenced by the rising average age of the population and low birth rate
   A market where environment awareness and eco-friendly production becomes more and
    more a pre-requisite for successful marketing of products


Marketing channels
        The emerging trend in Germany has been towards direct imports. The other noteworthy
feature is the integration of retailing and manufacturing, particularly for the footwear sector. This
has led to increased emphasis on distribution aspects of business. Other distributors, like
departmental stores, mail order houses, super markets and non-leather shops have also gained
importance. Many outlets get direct supplies either from the manufacturers and importers or from
wholesalers and buying associations (Einkaufs- Verband, e.V.).


        These developments necessitate the marketing strategies to be attuned to the specifics of
the different channels, keeping in sharp focus the changes taking place in the distribution pattern
of chain stores, retailers, discounters, etc.


        The strategy should focus on a structural approach to the promotion of export of leather
products from India. This must include market information for exploring new markets,
participation in different international trade fairs, organizing trade delegations, organizing buyer-
seller meets, liaising with the representatives of the buying houses, etc.


                                                 23
OBJECTIVES OF STUDY

• To know the employees‟ attitude towards the organization

• To know the reasons for the employees‟ positive attitude

• To know the reasons for the employees‟ negative attitude

• To know the employees‟ expectations from the organization

• To make suggestions to improve the attitude of the employees to the management.


                                               24
SCOPE OF STUDY

   Monitor transition from a previously owned proprietorial business to a subsidiary business.
   Measure the effects of company management over the previous two years.
   Monitor the organization‟s current state of maturity.
   Monitor the effects of personnel, policy, and strategy changes.
   Monitor the effects of market changes.


                                               25
LIMITATION
LIMITATION OF THE STUDY
    Only 100sample size has been taken for this study. So, if this study is     conducted to
      maximum persons, it may give accurate overall attitude of the employees.


    It is done in PKL LEATHER LIMITED, so it cannot resemble the entire population
      working in the whole industry.

    Time was a major limitation for our study.

    Some people did not respond properly for the questionnaire clearly.


                                            26
RESEARCH METHODOLOGY

RESEACH METHODOLOY

          Four types of studies can be called research namely reporting, description, explanation
and prediction can be called research. Cooper and Emory (1995:21) define research as a
systematic enquiry aimed at providing information to solve problems. Organization normally
support business research for one research ie is to obtain competitive advantage.

SAMPLE SIZE:

         Population :          500

        Unit           :       Management

       Sample size     :       100

RESEARCH STUDY:

       In this study “EMPLOYEE ATTITUDE” the design chosen for the study is descriptive in
nature. As the study is find out the employees opinion about the training programs and their
views and ideas to improve the training facilities.

SAMPLING

       The technique adapted for the sample was disproportionate stratified sampling. From the
universe, selected samples from various departments are chosen. Thus, samples were selected for
study and hence the sampling technique used was disproportionate stratified technique.


                                                 27
SOURCES OF DATA:

PRIMARY DATA

                The primary source include the actual information received directly concerned
with the problem of study. The researcher primarily collected the data about the employee
attitude towards the organization. The primary sources are mainly the general knowledge that
research knows about the topic and the respondents who provide sufficient information about the
topic.

SECONDARY DATA:

                Secondary data are the information, which are attained indirectly. It‟s not attained
directly from the employees. The secondary sources of information include the publicized,
unpublished documents and other such types of information. The public document such as
books, manuscripts, reports, records, papers and magazines are for secondary data collection.

DATA COLLECTION TOOLS:

                The tools needed for the data collection was questionnaire. The questionnaire
containing 20 questions was used to collect data from the employees. The resources for choosing
the questionnaire collection of data is the respondents will easy to answer the questions which
choice rather than asking them to write own. Every lesser time is required for answering the
questions. The respondents express their views in a clear manner by the survey.

PERIOD OF THE STUDY
         The study was conducted from 1 December to 30 December which altogether comprises
of one month.

RESEARCH DESIGN
         The research carried out the study with the descriptive type of research.
                                                 28
TARGET STUDY
               The target study confined to the researcher is PRISIDENCY KID LEATHER
LTD, GUDUVANCHERRY Works employees based on their evaluation of Employee attitude


Though EMPLOYEE ATTITUDE is given in almost all the organization, but only a few
organizations such as ltd takes its priority in organizing attitude programs & evaluating the
programs with continuous analysis for the development & upliftment of the employee‟s skills &
attitudes

SAMPLE DESIGN
        For this study two different types on non probability sample design were used.        •
CONVENIENCE SAMPLING

        This designs aims at the collection of information from any convenient group whose
views are relevant to the subject of study.

  JUDGEMENT SAMPLING

                  The second sampling used was the judgment technique, Where the group to be
interviewed was selected in advance by the judgment of the experts, within the organization

TOOLS USED FOR THE DATA ANALYSIS

      For the purpose of analysis and interpretation certain common methods were used through
diagrammatic representation like pie diagram and data collected by the questionnaire method and
data analysis in percentage analysis. It is a descriptive type of study .


                                                  29
RESEARCH DESIGN

      It is the specification of the methods and procedures for acquiring the information
      needed to structure or to solve problems. It stands for advance planning of the
      methods to be adopted for collecting relevant date and the techniques to be used in
      their analysis, keeping in view the objectives of the research.

Two types of research design were used for this study:-

3.12.1 EXPLORATIVE STUDY

      First an explorative study was undertaken, with an aim at gaining familiarity, or
      with an aim at achieving insights into the study, which dealt with the formulation
      of a more precise research problem . it was basically a pilot study which was
      undertaken before actual research.


The aims of this design was limited to

1     Gathering the various secondary sources of information.

2     Interview schedules with experts, to gather their insights and views

       about the study

3     Analysis of the various causes related to their study


                                            30
DESCRIPTIVE STUDY

   The second design used for this study was the descriptive study; the reason for using
   this design was to acquire knowledge in a detailed manner. This study basically
   aims at portraying the characteristics of the individuals and firms in a detailed
   manner, to find out the root cause analysis for the employee attitude evaluation and
   development in creating knowledge skills for the employees.

ORGANISING AND CONSTRUCTING THE FIELD STUDY

    The next stage, was to carry out a field survey, for this the personal interview
    method was undertaken so the necessary information could be collected from the
    respondents.


                                         31
TABLE - 8.1

                                          SKILL DETAILS


         S.NO            OPINION           NO.OF.RESPONDENTS            PERCENTAGE


            1               Agree                    74                         74


            2             Disagree                    6                         6


            3           Partially agree              20                         20


                            Total                    100                       100

INFERENCE:
                    From the above the 74% of the respondents are „Agree‟ that the job is enables
them to develop their skills .20% of the respondents „Partially Agree‟ that the job enables them
to develop their skills, but remaining 6% of respondents „Disagree‟ that the job is not helpful to
develop their skills.


                                                32
CHART-8.1

                   SKILL DETAILS


             74
80

70

60

50

40
                                            20
30

20                       6
10

 0
     AGREE        DISAGREE        PARTIALLY AGREE


             .


                             33
TABLE-8.2

                                    LENGTH OF SERVICE

         S.NO        OPINION              NO.OF.RESPONDENTS             PERCENTAGE


           1          0-2 years                    30                          30


           2          3-4 years                    40                          40


           3          4-5 years                    14                          14


           4        more than 10                   16                          16
                       years

                        Total                      100                        100


INFERENCE:
         From the above it is clear that 40% of the Respondents says that they are working
around „3-4 years‟ in the company .30% of Respondents are working between „0-2 years‟ in
the company.16% of the Respondents are senior of the company .14% of the respondents says
that „5-10‟ years they are working in a company.


                                              34
CHART-8.2

                 LENGTH OF SERVICE

                         40


40
            30
35

30

25
                                                            16
                                           14
20

15

10

 5

 0
     0-2 years   3-4 years         4-5 years    more than 10 years


                              35
TABLE -8.3

                                   FAMILY DETAILS


     S.NO        OPINION              NO.OF.RESPONDENTS                  PERCENTAGE


       1              1                             20                           20


       2              2                             40                           40


       3              3                             24                           24


       4          Above 3                           16                           16


                    Total                           100                         100


INFERENCE:
            From the above table it is clear that 40% of the respondents says that „2 members‟ of
their family depend on them .24% of the respondents says „3 members‟ of their family depend on
them . 20% of the respondents says „1 member‟ of their family depend on them. Only 16% of
members says above „4 members‟ of their family depend on them.


                                               36
CHART-8.3

          FAMILY DETAILS


45
              40
40
35
30
                           24
25
     20
20                                16
15
10
 5
 0
     1        2            3    Above 3
     1        2            3       4


                   37
TABLE -8.4

                  ACCEPTANCE OF CHANGING CONDITION

 S.NO         OPINION              NO.OF.RESPONDENTS                   PERCENTAGE


   1             Yes                            80                            80


   2              No                            20                            20


                 Total                         100                            100


INFERENCE:
              From the above that it is clear that 80% of the respondents have said „YES‟
because they are able to adapt to themself to the changing conditions or unexpected obstacles
in the organization. But 20% of respondents said „NO‟ for that they are not able to adapt to
themself to the changing conditions or unexpected obstacles in the organization.


                                               38
CHART-8.4

ACCEPTANCE OF CHANGING CONDITION


               39
TABLE-8.5

                                   STRESS DETAILS


 S.NO          OPINION                NO.OF.RESPONDENTS                  PERCENTAGE


   1             Agree                            30                             30


   2            Disagree                          70                             70


                  Total                           100                           100


INFERENCE:
              From the above table it is clear that 70% of the respondents „Disagree‟ that they
do not undergo stress when changes are preferred. 30% of the respondents agree that they
undergo stress when change are preferred .


                                             40
CHART-8.5
             STRESS DETAILS


80

                                70
70


60


50


40

      30
30


20


10


 0
     Agree                    disagree
      1                          2


                   41
TABLE-8.6

                                  OPTIMISTIC BEHAVIOUR


 S.NO          OPINION                NO.OF.RESPONDENTS                     PERCENTAGE


   1               Yes                               66                            66


   2               No                                34                            34


                  Total                              100                           100


INFERENCE:
                 From the above table 66% of respondents says „Yes‟ that they are able maintain
intensity and remain optimistic and persistent even under adversity . 34% of respondents says
„No‟ for they are not maintain intensity and remain optimistic and persistent under adversity.


                                                42
CHART-8.6

                OPTIMISTIC BEHAVIOUR


           66
70


60


50
                        34
40


30


20


10


 0
     Yes           No


                             43
TABLE-8.7

     ABILITY IS SET PRIORITIES AND ANTICIPATE PONTENTIAL
                  THERATS OR OPPORTUNITIES


    S.NO         OPINION             NO.OF.RESPONDENTS                   PERCENTAGE


       1             Yes                            74                           74


       2              No                            26                           26


                    Total                           100                          100


INFERENCE:
             From the above table 74% of respondents says „Yes‟ as they are ready to give
priorities and anticipate potential threats or opportunities in an organisation. But remaining 26%
says „No‟ as they are not able to adapt set priorities and anticipate potential threats or
opportunities.


                                               44
CHART-8.7

ABILITY IS SET PRIORITIES AND ANTICIPATE PONTENTIAL
             THERATS OR OPPORTUNITIES


    80           74
    70
    60
    50
    40
    30                                26

    20
    10
     0
                 Yes                  No
                 1                     2


                          45
TABLE-8.8

                             VISION SHARING DETAILS


 S.NO            OPINION                NO.OF.RESPONDENTS                     PERCENTAGE


    1              Yes                              76                               76


    2               No                              24                               24


                  Total                             100                              100


INFERENCE:
                 From the above table 76% of respondents says „Yes‟ for they           are share
vision with others influences other to translate vision into action but remaining 24% have reject
the statement.


                                               46
CHART -8.8
VISION SHARING DETAILS


          47
TABLE-8.9

                        ABILITY TO RESLOVE CONFLICT


 S.NO           OPINION                  NO.OF.RESPONDENTS                    PERCENTAGE


    1        Strongly disagree                       10                              10


    2             disagree                           20                              20


    3              Agree                             40                              40


    4         Strongly agree                         30                              30


                   Total                            100                             100


INFERENCE:

               From the above table 40% of respondents „Agree‟ to resolves Conflicts in a
positive manner. Remaining 30% of respondents „Strongly agree‟ to resolves in positive manner.
20% of respondents „Disagree‟ with this statement.10% respondents strongly disagree that
conflicts of positive and constructive manner to minimize negative impact.


                                              48
CHART-8.9
               ABILITY TO RESLOVE CONFLICT


                                                  40

40
                                                                 30
35

30

25                              20

20
                10
15

10

 5

 0
     Strongly disagree   disagree         Agree        Strongly agree


                                     49
TABLE-8.10

                               GOAL ACCOMPLISHMENT

 S.NO           OPINION             NO.OF.RESPONDENTS                  PERCENTAGE


   1         Strongly Disagree                   16                           16


   2             Disagree                        14                           14


   3              Agree                          20                           20


   4          Strongly agree                     50                           50


                  Total                          100                          100


INFERENCE:
               From the above table 50% of respondents   „Strongly agree‟. That the company
inspire/motivate & guide others towards goal. Remaining 20%     „Agree‟ with this statement
.16% have „Strongly Disagree‟ statement .Remaining14% of respondents „Disagree‟ with this
statement.


                                            50
CHART-8.10

                            GOAL ACCOMPLISHMENT


  Strongly agree
                                                                            50


           Agree
                                              20


        disagree
                                       14


Strongly disagree
                                       16


                    0   5    10   15   20    25    30   35   40   45   50


                                        51
TABLE-8.11

                           DETAILS OF PERSON TO BE RELIED


 S.NO           OPINION             NO.OF.RESPONDENTS                  PERCENTAGE


    1                Yes                         60                           60


    2                 No                         40                           40


                     Total                       100                         100


INFERENCE:
            From the table indicates that 60% respondents says „Yes‟ for they are person on
whom someone can rely to carry out tasks effectively . Remaining 40% respondents says „No‟
for this statement


                                            52
CHART-8.11

           DETAILS OF PERSON TO BE RELIED


           60


60


                         40
50


40


30


20


10


 0
     Yes            No


                              53
TABLE-8.12

                              ABILITY TO TAKES UP RESPONSIBILITY


 S.NO             OPINION             NO.OF.RESPONDENTS                 PERCENTAGE


    1                   Yes                        56                           56


    2                   No                         44                           44


                    Total                         100                          100


INFERENCE
        From the above table 56% of the respondents says „yes‟ for they are satisfied that
responsibility are complete in a timely manner and within budget . Remaining 40% of
respondents say „No‟.


                                            54
CHART- 8.12

ABILITY TO TAKES UP RESPONSIBILITY


           55
TABLE-8.13

                     ABILITY TO SATISFY NEEDS OF CLIENTS


  S.NO                OPINION                  NO.OF.RESPONDENTS                     PERCENTAGE


     1                    Yes                               82                              82


     2                    No                                18                              18


                         Total                             100                              100


INFERENCE:
            From the table indicates that 82% of respondents are says „Yes‟ for they are able to the
client‟s needs    to develop the business. Remaining 18% of respondents say that it is not
necessary


                                                 56
CHART-8.13
ABILITY TO SATISFY NEEDS OF CLIENTS


                57
TABLE-8.14

                    ABILITY TO TAKE TIMELY DECISIONS

  S.NO           OPINION              NO.OF.RESPONDENTS                 PERCENTAGE


    1         Strongly disagree                     8                           8


    2             disagree                         12                          12


    3              Agree                           56                          56


    4          Strongly agree                      24                          24


                    Total                          100                        100


INFERENCE:
             From the above table it is inferred that 56% of the respondents „Agree‟ that the
company makes effective and timely decisions , even the data is limited the solutions produce un
pleasant consequences. 24%of the respondents „Strongly agree‟ the company makes effectives
and timely decisions , even the data is limited the solutions produce un pleasant
consequences.12% of the respondents „Disagree‟ that the company does not make effective and
timely decision even data is limited or solutions produce un pleasant consequences. 8% of the
respondents „Strongly disagree‟ that the company make effective and timely decision even data
is limited or solutions produce un pleasant consequences.


                                              58
CHART-8.14
              ABILITY TO TAKE TIMELY DECISIONS


                                 56
60

50

40
                                            24
30
                     12
20        8
10

 0
     Strongly    disagree     Agree   Strongly
     disagree                          agree


                                 59
TABlE-8.15

        ABILITY TO DISTINGUISH RELEVANT AND IRRELEVANT

S.NO       OPINION                  NO.OF.RESPONDENTS                PERCENTAGE

    1        Strongly disagree                   16                           16

    2             disagree                       12                           12

    3              Agree                         48                           48

    4         Strongly agree                     24                           24

                   Total                        100                           100


INFERENCE:
                   From the above table it is clear that 48% of the respondents „Agree‟ that they
are able to make logical decisions relevant & irrelevant information. 24% of the respondents
„Strongly agree‟ that they are able to make logical decisions on relevant & irrelevant
information. 16% of the respondents „Strongly disagree‟ that they are not able to make logical
decisions and irrelevant.12% the respondents „Strongly disagree‟ that they are not able to make
logical decisions and irrelevant.


                                               60
CHART-8.15

ABILITY TO DISTINGUISH RELEVANT AND IRRELEVANT


                      61
TABLE-8.16

                REWARD FOR HARDWORK DETAILS


    S.NO     OPINION        NO.OF.RESPONDENTS PERCENTAGE


      1          Yes                     70                   70


      2          No                      30                   30


                Total                    100                  100


INFERENCE:

    From the above table 70% of the respondents says „Yes‟ that they are
    rewarded for that hard work .Remaining 30% says „No‟ for this statement


                                    62
CHART- 8.16
REWARD FOR HARDWORK DETAILS


            63
TABLE- 8.17

                                  PROMOTION DETAILS

  S.NO           OPINION                 NO.OF.RESPONDENTS                    PERCENTAGE


    1         Strongly disagree                       6                             6


    2              disagree                          14                            14


    3               Agree                            46                            46


    4          Strongly agree                        34                            34


                    Total                            100                           100


INFERENCE:
                From the above table 46% of the respondents „Agree‟ that job promotions with
in the company fair and reasonable. 34% of the respondents „Strongly agree ‟ that job
promotions with in the company is not fair and reasonable. 14% of the respondents „disagree‟
that job promotions with in the company is not fair and reasonable. 6% of the respondents
„Strongly disagree‟ that job promotions with in the company fair and reasonable.


                                               64
CHART-8.17
PROMOTION DETAILS


        65
TABLE- 8.18

                       DEMOTION /INCREMENT DETAILS

  S.NO           OPINION                 NO.OF.RESPONDENTS                   PERCENTAGE


    1                Yes                             72                              72


    2                No                              28                              28


                    Total                           100                             100


INFERENCE:
   From the above table it is clear that 72% of the respondents says „Yes‟ for the increment on
letter performance and demotion on job improper performance. Remaining 28% say „No‟ for this
statement .


                                              66
CHART-8.18
           DEMOTION /INCREMENT DETAILS


           72
80

70

60

50

40                      28

30

20

10

 0
     Yes           No


                             67
TABLE -8.19

            ABILITY TO DEVLOP NEW AND MAN EFFICIENCY

 S.NO            OPINION               NO.OF.RESPONDENTS                 PERCENTAGE

    1       Strongly disagree                      20                            20

    2             disagree                         12                            12

    3              Agree                           48                            48

    4         Strongly agree                       20                            20

                    Total                         100                           100


INFERENCE:
              From the above table 48% of people „Agree‟ that they are encouraged to develop
new and more efficient ways to do their work 26% of respondent „Disagree‟ says that they are
not encouraged to develop new and More efficient ways to do their work .20% of people‟s
„Strongly agree‟ that they are encouraged to develop new and more efficient ways to do their
work . 14% of respondent says „Strongly disagree‟ that they are not encouraged to develop new
and More efficient ways to do their work.


                                             68
CHART-8.19
     ABILITY TO DEVLOP NEW AND MAN EFFICIENCY


                                                 48

50
45
40
                 20
35
30
25                                                              20
                               12
20
15
10
5
0
     Strongly disagree   disagree        Agree        Strongly agree


                                    69
TABLE-8.20

             FLEXIBLITY OF MANAGEMENT IS BALANCING WORK


  S.NO             OPINION                  NO.OF.RESPONDENTS                     PERCENTAGE

    1          Strongly disagree                       18                               18

    2               disagree                           14                               14

    3                Agree                             20                               20

    4           Strongly agree                         48                               48

                     Total                             100                              100


INFERENCE:
                From the above table we understand that 48% of the respondents „Strongly
agree‟ that management is flexible and understands the importance of balancing both work and
personal life.20% of respondents „Agree‟ that management is flexible and understands the
importance of balancing both work and personal life.18% of respondents „Strongly disagree‟
that management is not flexible and understands the importance of balancing both work and
personal life.14% of respondents „Disagree‟ that management is not flexible and understands the
importance of balancing both work and personal life.


                                              70
CHART-8.20
FLEXIBLITY OF MANAGEMENT IS BALANCING WORK


                                                                48

50
45
40
35
30                                                20
                18
25                              14
20
15
10
 5
 0
     Strongly disagree   disagree         Agree        Strongly agree


                                     71
FINDINGS

 The job enables the employees to develop their skills.

 The employees change themselves according to the changing conditions of the organization.

 The employees are ready adapt themselves to unexpected obstacles in the organization.

 The employees remain persistent even under adversity.

 The employees try to solve and manage conflict in a positive and constructive manner.

 The company inspires motivation and guides the employees towards the goal of the
  organization.

 The employees works with specific responsibility.

 The employees who work hard are reward by the company.

 The management is flexible and ready to understand the employees personal life.

 The employees are encouraged to develop new and more efficient ways to work


                                             72
SUGGESTIONS

 The job gives to their employees with full involvement.

 Efficient workers are encouraged with promotion and incentives.

 We train the adaptation of work should listen the employees.

 The management should listen the employee quaries

 The employee should be monitored properly


                                        73
CONCLUSION

       Choosing the right type of person to the right type of job enables the employees to
do the work with the efficiency and diligently. The organization motivates the employees
with the good environment and remuneration. The employees working in the organization
is flexible and changes themselves according to the working conditions. The employee‟s
conflicts are managed by the organization in a constructive manner. The efficient workers
are encouraged with promotion and good remuneration. The objectives of the
organization it is clearly defined by the employees. The job given to the employees in
such that improves quality of the workers. The employees in a organization should not be
given any potential threats by employers. The company should inspire and guide the
employees for achievement of goal of the organization.


       The management guides and direct the employees to vital accomplishment of the
enterprise goal . The introduces the subordinates to work with confidence and zeal. The
management also stimulates to strive and willing to attend the organizational objectives


                                        74
 BIBLOGRAPHY:


               This information is collected from books, and web resources.


 BOOKS:


 Organisation behavior               -        Philip kotlar

 Organisation behaviour              -        J.Jayasankar

 Marketing research                  -        P.Ravilochanan


 WEB RESOURCES:
 www.pklindia.com

 Panther@pklindia.com

 www.google


                                         75
ANNEXURE

                             EMPLOYEE ATTITUDE

• This Questionnaire to be filled by the Employees of ____________________

• Please indicate a Tick Mark on the preferred option for each aspect in the

 Questionnaire


      NAME                        :

      AGE                         :


      Designation                 :

      Sex                         :

      A. Male
      B. Female


   1. This job enables me to develop my skills ?

      A) Agree
      B) Dis agree
      C) Partially agree

   2. How long have you worked for this company?

      A. 0 – 2 Years
      B. 3 – 4 Years
                                           76
C. 5 – 10 years
   D. More than 10 years


3. No of Dependents in your family?

   A.   1
   B.   2
   C.   3
   D.   Above 3. (Please specify)

4. Do you adapt yourself to the changing conditions, or unexpected obstacles in the
   organisation?


        A) Yes                         B) No


5. I undergo stress when change is preferred?


        A) Agree                        B) Dis agree


6. Do you maintain focus and intensity and remain optimistic and persistent, even
   under adversity?

        A) Yes                          B) No

7. Can you determine objectives, set priorities and anticipate potential threats or
   opportunities?

        A) Yes                         B) No


8. Do you think that you can share vision with others; influences others to translate
   vision into action?
                                         77
B) Yes                         B) No


9. I can you manage and resolves conflicts in a positive and constructive manner to
   minimize negative impact?

       A) Strongly disagree              B) Disagree

       C) Agree                              D) Strongly agree


10. Does your company Inspire, motivate, and guide others toward goal
    accomplishments?

       A) Strongly disagree                  B) Disagree

       C) Agree                              D) strongly agree

11. Do you feel that you are a person someone who can be relied upon to carry out your
    tasks effectively?


       A) Yes                         B) No


12. You are a person who can be relied upon to ensure that projects within areas of
   specific responsibility are completed in a timely manner and within budget.?


       A) Yes                         B) No


13. Do you meet the needs of your clients?


                                         78
A) Yes                        B) No


14. Does your company makes effective and timely decisions, even when data is limited
   or solutions produce unpleasant consequences.?

   A)     Strongly disagree              B) Disagree

   C)     Agree                          D) Strongly agree


15. Can you distinguish between relevant and irrelevant information to make logical
    decisions.


          A)      Strongly disagree            B) Disagree

          C)      Agree                         D) Strongly agree

16. Did the hard work is usually rewarded by my Company?

        A) Yes                        B) No


17. Job promotions within the company are fair and reasonable?


   A)     Strongly disagree              B) Disagree

   C)     Agree                          D) Strongly agree


18. Do you prefer this system of increment on better performance & demotion on
   improper performance?
                                        79
A) Yes                                  B) No


  19. I am encouraged to develop new and more efficient ways to do my work?


      A)    Strongly disagree            B) Disagree

     C)     Agree                         D) strongly agree


  20. Management is flexible and understands the importance of balancing my work and
      personal life?


      A)    Strongly disagree            B) Disagree

     C)     Agree                         D) Strongly agree

  21. What changes, if any, do you feel need to made in your department to improve
     working condition ?
     ________________________________________________________________________
     ________________________________________________________________________
     ________________________________________________________________________
     _______________________________________________________________________

  22. What changes, if any, do you feel need to be made in the company to improve
     working condition?
     ________________________________________________________________________
     ________________________________________________________________________
     ________________________________________________________________________
     ________________________________________________________________________
***********************************************************************

  THANKS FOR DEVOTING YOUR PRECIOUS TIME FOR FILLING THIS
                     QUESTIONNAIRE

                                        80
***********************************************************************

Date        :

Signature   :


                                   81

Mais conteúdo relacionado

Mais procurados

Motivation in Organization Behaviour pdf
Motivation in Organization Behaviour pdfMotivation in Organization Behaviour pdf
Motivation in Organization Behaviour pdfSadiahAhmad
 
Competency mapping ppt
Competency mapping pptCompetency mapping ppt
Competency mapping pptVrunda Gandhi
 
Case study on organizational behaviour
Case study on organizational behaviourCase study on organizational behaviour
Case study on organizational behaviourTanu Priya
 
Organizational Behavior : Values
Organizational Behavior : Values Organizational Behavior : Values
Organizational Behavior : Values Dr Kiran Kakade
 
International Human Resources Management
International Human Resources ManagementInternational Human Resources Management
International Human Resources ManagementMaksudul Huq Chowdhury
 
Job satisfaction - does it impact on-job performance?
Job satisfaction - does it impact on-job performance?Job satisfaction - does it impact on-job performance?
Job satisfaction - does it impact on-job performance?Fatema Tandiwala
 
Psychological contract Human Resources
Psychological contract Human ResourcesPsychological contract Human Resources
Psychological contract Human ResourcesSujen G George
 
A Study on Employees Absenteeism
A Study on Employees AbsenteeismA Study on Employees Absenteeism
A Study on Employees AbsenteeismProjects Kart
 
Employee Satisfaction at Workplace
Employee Satisfaction at WorkplaceEmployee Satisfaction at Workplace
Employee Satisfaction at WorkplaceRakshith M.R
 
PROJECT REPORT ON EMPLOYEE SATISFACTION (sample)
PROJECT REPORT ON EMPLOYEE SATISFACTION (sample)PROJECT REPORT ON EMPLOYEE SATISFACTION (sample)
PROJECT REPORT ON EMPLOYEE SATISFACTION (sample)Ajeesh Mk
 
A project report on an assessment of job satisfaction
A project report on an assessment of job satisfactionA project report on an assessment of job satisfaction
A project report on an assessment of job satisfactionBabasab Patil
 
Review of literature on employees satisfaction
Review of literature on employees satisfaction Review of literature on employees satisfaction
Review of literature on employees satisfaction Himanshu Sikarwar
 
Individual behaviour-Organisational Behaviour
Individual behaviour-Organisational BehaviourIndividual behaviour-Organisational Behaviour
Individual behaviour-Organisational BehaviourRahul Mahida
 
Job Satisfaction - Measurement & Importance.
Job Satisfaction - Measurement & Importance.Job Satisfaction - Measurement & Importance.
Job Satisfaction - Measurement & Importance.AmandaBvera
 
Components Of Compensation Management
Components Of Compensation ManagementComponents Of Compensation Management
Components Of Compensation Managementrahul23t263
 
hrd systems, processes, outcomes and organizational effectiveness
hrd systems, processes, outcomes and organizational effectiveness hrd systems, processes, outcomes and organizational effectiveness
hrd systems, processes, outcomes and organizational effectiveness Vidhu Arora
 

Mais procurados (20)

S 7. Understanding Power Tactics
S 7. Understanding Power TacticsS 7. Understanding Power Tactics
S 7. Understanding Power Tactics
 
Motivation in Organization Behaviour pdf
Motivation in Organization Behaviour pdfMotivation in Organization Behaviour pdf
Motivation in Organization Behaviour pdf
 
Competency mapping ppt
Competency mapping pptCompetency mapping ppt
Competency mapping ppt
 
Case study on organizational behaviour
Case study on organizational behaviourCase study on organizational behaviour
Case study on organizational behaviour
 
Organizational Behavior : Values
Organizational Behavior : Values Organizational Behavior : Values
Organizational Behavior : Values
 
International Human Resources Management
International Human Resources ManagementInternational Human Resources Management
International Human Resources Management
 
Job satisfaction - does it impact on-job performance?
Job satisfaction - does it impact on-job performance?Job satisfaction - does it impact on-job performance?
Job satisfaction - does it impact on-job performance?
 
Psychological contract Human Resources
Psychological contract Human ResourcesPsychological contract Human Resources
Psychological contract Human Resources
 
A Study on Employees Absenteeism
A Study on Employees AbsenteeismA Study on Employees Absenteeism
A Study on Employees Absenteeism
 
Employee Satisfaction at Workplace
Employee Satisfaction at WorkplaceEmployee Satisfaction at Workplace
Employee Satisfaction at Workplace
 
PROJECT REPORT ON EMPLOYEE SATISFACTION (sample)
PROJECT REPORT ON EMPLOYEE SATISFACTION (sample)PROJECT REPORT ON EMPLOYEE SATISFACTION (sample)
PROJECT REPORT ON EMPLOYEE SATISFACTION (sample)
 
A project report on an assessment of job satisfaction
A project report on an assessment of job satisfactionA project report on an assessment of job satisfaction
A project report on an assessment of job satisfaction
 
Review of literature on employees satisfaction
Review of literature on employees satisfaction Review of literature on employees satisfaction
Review of literature on employees satisfaction
 
Vroom's expectancy theory of motivation
Vroom's expectancy theory of motivationVroom's expectancy theory of motivation
Vroom's expectancy theory of motivation
 
Job frustration
Job frustrationJob frustration
Job frustration
 
Individual behaviour-Organisational Behaviour
Individual behaviour-Organisational BehaviourIndividual behaviour-Organisational Behaviour
Individual behaviour-Organisational Behaviour
 
Job Satisfaction - Measurement & Importance.
Job Satisfaction - Measurement & Importance.Job Satisfaction - Measurement & Importance.
Job Satisfaction - Measurement & Importance.
 
Components Of Compensation Management
Components Of Compensation ManagementComponents Of Compensation Management
Components Of Compensation Management
 
New trends in compensation management
New trends in compensation managementNew trends in compensation management
New trends in compensation management
 
hrd systems, processes, outcomes and organizational effectiveness
hrd systems, processes, outcomes and organizational effectiveness hrd systems, processes, outcomes and organizational effectiveness
hrd systems, processes, outcomes and organizational effectiveness
 

Destaque

HRM and Administration Masterclass
HRM and Administration MasterclassHRM and Administration Masterclass
HRM and Administration MasterclassCharles Cotter, PhD
 
Positive Attitude
Positive AttitudePositive Attitude
Positive AttitudeRajiv Bajaj
 
Employee Attitude And Their Effects
Employee Attitude And Their EffectsEmployee Attitude And Their Effects
Employee Attitude And Their EffectsLomer Oanilacam
 
Personality, attitudes, workplace behavior and motivation ( former)
Personality, attitudes, workplace behavior and motivation ( former)Personality, attitudes, workplace behavior and motivation ( former)
Personality, attitudes, workplace behavior and motivation ( former)Kishwar Sayeed
 

Destaque (6)

Hrm overview
Hrm overviewHrm overview
Hrm overview
 
HRM and Administration Masterclass
HRM and Administration MasterclassHRM and Administration Masterclass
HRM and Administration Masterclass
 
Positive Attitude
Positive AttitudePositive Attitude
Positive Attitude
 
Good work attitude ppt.
Good work attitude ppt.Good work attitude ppt.
Good work attitude ppt.
 
Employee Attitude And Their Effects
Employee Attitude And Their EffectsEmployee Attitude And Their Effects
Employee Attitude And Their Effects
 
Personality, attitudes, workplace behavior and motivation ( former)
Personality, attitudes, workplace behavior and motivation ( former)Personality, attitudes, workplace behavior and motivation ( former)
Personality, attitudes, workplace behavior and motivation ( former)
 

Semelhante a Understanding Attitudes and Their Importance

Attitudes beliefs values ppt @ bec doms bagalkot mba 1
Attitudes beliefs values ppt @ bec doms bagalkot mba 1Attitudes beliefs values ppt @ bec doms bagalkot mba 1
Attitudes beliefs values ppt @ bec doms bagalkot mba 1Babasab Patil
 
Attitudes beliefs values ppt @ bec doms bagalkot mba
Attitudes beliefs values ppt @ bec doms bagalkot mbaAttitudes beliefs values ppt @ bec doms bagalkot mba
Attitudes beliefs values ppt @ bec doms bagalkot mbaBabasab Patil
 
Organisational Attitude
Organisational AttitudeOrganisational Attitude
Organisational AttitudeAnup Mohan
 
understanding-individual-behaviour.pptx
understanding-individual-behaviour.pptxunderstanding-individual-behaviour.pptx
understanding-individual-behaviour.pptxKhagendraParsadBhatt
 
498971863-psychological notes on Attitude-Ppt-1.pptx
498971863-psychological notes on Attitude-Ppt-1.pptx498971863-psychological notes on Attitude-Ppt-1.pptx
498971863-psychological notes on Attitude-Ppt-1.pptx2882004joe
 
shraddha mishra-mba-hr-project-report
shraddha mishra-mba-hr-project-reportshraddha mishra-mba-hr-project-report
shraddha mishra-mba-hr-project-reportbzdbsfdz
 
Attitudes ppt @ bec doms mba bagalkot
Attitudes ppt @ bec doms mba bagalkotAttitudes ppt @ bec doms mba bagalkot
Attitudes ppt @ bec doms mba bagalkotBabasab Patil
 
Attitudes ppt @ bec doms mba bagalkot 1
Attitudes ppt @ bec doms mba bagalkot 1Attitudes ppt @ bec doms mba bagalkot 1
Attitudes ppt @ bec doms mba bagalkot 1Babasab Patil
 
Chapter 7 Attitude
Chapter 7 AttitudeChapter 7 Attitude
Chapter 7 Attitudequlbabbas4
 
PGDM-Unit-3 Attitutes.pptx
PGDM-Unit-3 Attitutes.pptxPGDM-Unit-3 Attitutes.pptx
PGDM-Unit-3 Attitutes.pptxbibha737
 
Presentation 1 perception
Presentation 1 perceptionPresentation 1 perception
Presentation 1 perceptionKarunakar Reddy
 
SOCIOLOGICAL AND PSYCHOLOGICAL FOUNDATIONS FOR SOCIAL WORK.docx
SOCIOLOGICAL AND PSYCHOLOGICAL FOUNDATIONS FOR SOCIAL WORK.docxSOCIOLOGICAL AND PSYCHOLOGICAL FOUNDATIONS FOR SOCIAL WORK.docx
SOCIOLOGICAL AND PSYCHOLOGICAL FOUNDATIONS FOR SOCIAL WORK.docxWalterHunt4
 

Semelhante a Understanding Attitudes and Their Importance (20)

Attitudes beliefs values ppt @ bec doms bagalkot mba 1
Attitudes beliefs values ppt @ bec doms bagalkot mba 1Attitudes beliefs values ppt @ bec doms bagalkot mba 1
Attitudes beliefs values ppt @ bec doms bagalkot mba 1
 
Attitudes beliefs values ppt @ bec doms bagalkot mba
Attitudes beliefs values ppt @ bec doms bagalkot mbaAttitudes beliefs values ppt @ bec doms bagalkot mba
Attitudes beliefs values ppt @ bec doms bagalkot mba
 
Attitude report
Attitude reportAttitude report
Attitude report
 
Module 2 bba hbo
Module 2 bba hboModule 2 bba hbo
Module 2 bba hbo
 
Organisational Attitude
Organisational AttitudeOrganisational Attitude
Organisational Attitude
 
understanding-individual-behaviour.pptx
understanding-individual-behaviour.pptxunderstanding-individual-behaviour.pptx
understanding-individual-behaviour.pptx
 
Attitude
Attitude Attitude
Attitude
 
Attitudes
AttitudesAttitudes
Attitudes
 
498971863-psychological notes on Attitude-Ppt-1.pptx
498971863-psychological notes on Attitude-Ppt-1.pptx498971863-psychological notes on Attitude-Ppt-1.pptx
498971863-psychological notes on Attitude-Ppt-1.pptx
 
Attitude
AttitudeAttitude
Attitude
 
Basic psychological process
Basic psychological processBasic psychological process
Basic psychological process
 
shraddha mishra-mba-hr-project-report
shraddha mishra-mba-hr-project-reportshraddha mishra-mba-hr-project-report
shraddha mishra-mba-hr-project-report
 
Attitudes ppt @ bec doms mba bagalkot
Attitudes ppt @ bec doms mba bagalkotAttitudes ppt @ bec doms mba bagalkot
Attitudes ppt @ bec doms mba bagalkot
 
Attitudes ppt @ bec doms mba bagalkot 1
Attitudes ppt @ bec doms mba bagalkot 1Attitudes ppt @ bec doms mba bagalkot 1
Attitudes ppt @ bec doms mba bagalkot 1
 
Chapter 7 Attitude
Chapter 7 AttitudeChapter 7 Attitude
Chapter 7 Attitude
 
PGDM-Unit-3 Attitutes.pptx
PGDM-Unit-3 Attitutes.pptxPGDM-Unit-3 Attitutes.pptx
PGDM-Unit-3 Attitutes.pptx
 
Social attitude
Social attitudeSocial attitude
Social attitude
 
Presentation 1 perception
Presentation 1 perceptionPresentation 1 perception
Presentation 1 perception
 
ATTITUDE (1).pdf
ATTITUDE (1).pdfATTITUDE (1).pdf
ATTITUDE (1).pdf
 
SOCIOLOGICAL AND PSYCHOLOGICAL FOUNDATIONS FOR SOCIAL WORK.docx
SOCIOLOGICAL AND PSYCHOLOGICAL FOUNDATIONS FOR SOCIAL WORK.docxSOCIOLOGICAL AND PSYCHOLOGICAL FOUNDATIONS FOR SOCIAL WORK.docx
SOCIOLOGICAL AND PSYCHOLOGICAL FOUNDATIONS FOR SOCIAL WORK.docx
 

Último

Q-Factor HISPOL Quiz-6th April 2024, Quiz Club NITW
Q-Factor HISPOL Quiz-6th April 2024, Quiz Club NITWQ-Factor HISPOL Quiz-6th April 2024, Quiz Club NITW
Q-Factor HISPOL Quiz-6th April 2024, Quiz Club NITWQuiz Club NITW
 
Concurrency Control in Database Management system
Concurrency Control in Database Management systemConcurrency Control in Database Management system
Concurrency Control in Database Management systemChristalin Nelson
 
Beauty Amidst the Bytes_ Unearthing Unexpected Advantages of the Digital Wast...
Beauty Amidst the Bytes_ Unearthing Unexpected Advantages of the Digital Wast...Beauty Amidst the Bytes_ Unearthing Unexpected Advantages of the Digital Wast...
Beauty Amidst the Bytes_ Unearthing Unexpected Advantages of the Digital Wast...DhatriParmar
 
INTRODUCTION TO CATHOLIC CHRISTOLOGY.pptx
INTRODUCTION TO CATHOLIC CHRISTOLOGY.pptxINTRODUCTION TO CATHOLIC CHRISTOLOGY.pptx
INTRODUCTION TO CATHOLIC CHRISTOLOGY.pptxHumphrey A Beña
 
4.11.24 Poverty and Inequality in America.pptx
4.11.24 Poverty and Inequality in America.pptx4.11.24 Poverty and Inequality in America.pptx
4.11.24 Poverty and Inequality in America.pptxmary850239
 
Man or Manufactured_ Redefining Humanity Through Biopunk Narratives.pptx
Man or Manufactured_ Redefining Humanity Through Biopunk Narratives.pptxMan or Manufactured_ Redefining Humanity Through Biopunk Narratives.pptx
Man or Manufactured_ Redefining Humanity Through Biopunk Narratives.pptxDhatriParmar
 
Q-Factor General Quiz-7th April 2024, Quiz Club NITW
Q-Factor General Quiz-7th April 2024, Quiz Club NITWQ-Factor General Quiz-7th April 2024, Quiz Club NITW
Q-Factor General Quiz-7th April 2024, Quiz Club NITWQuiz Club NITW
 
MS4 level being good citizen -imperative- (1) (1).pdf
MS4 level   being good citizen -imperative- (1) (1).pdfMS4 level   being good citizen -imperative- (1) (1).pdf
MS4 level being good citizen -imperative- (1) (1).pdfMr Bounab Samir
 
Mythology Quiz-4th April 2024, Quiz Club NITW
Mythology Quiz-4th April 2024, Quiz Club NITWMythology Quiz-4th April 2024, Quiz Club NITW
Mythology Quiz-4th April 2024, Quiz Club NITWQuiz Club NITW
 
Narcotic and Non Narcotic Analgesic..pdf
Narcotic and Non Narcotic Analgesic..pdfNarcotic and Non Narcotic Analgesic..pdf
Narcotic and Non Narcotic Analgesic..pdfPrerana Jadhav
 
Multi Domain Alias In the Odoo 17 ERP Module
Multi Domain Alias In the Odoo 17 ERP ModuleMulti Domain Alias In the Odoo 17 ERP Module
Multi Domain Alias In the Odoo 17 ERP ModuleCeline George
 
How to Fix XML SyntaxError in Odoo the 17
How to Fix XML SyntaxError in Odoo the 17How to Fix XML SyntaxError in Odoo the 17
How to Fix XML SyntaxError in Odoo the 17Celine George
 
Transaction Management in Database Management System
Transaction Management in Database Management SystemTransaction Management in Database Management System
Transaction Management in Database Management SystemChristalin Nelson
 
Student Profile Sample - We help schools to connect the data they have, with ...
Student Profile Sample - We help schools to connect the data they have, with ...Student Profile Sample - We help schools to connect the data they have, with ...
Student Profile Sample - We help schools to connect the data they have, with ...Seán Kennedy
 
Blowin' in the Wind of Caste_ Bob Dylan's Song as a Catalyst for Social Justi...
Blowin' in the Wind of Caste_ Bob Dylan's Song as a Catalyst for Social Justi...Blowin' in the Wind of Caste_ Bob Dylan's Song as a Catalyst for Social Justi...
Blowin' in the Wind of Caste_ Bob Dylan's Song as a Catalyst for Social Justi...DhatriParmar
 
How to Make a Duplicate of Your Odoo 17 Database
How to Make a Duplicate of Your Odoo 17 DatabaseHow to Make a Duplicate of Your Odoo 17 Database
How to Make a Duplicate of Your Odoo 17 DatabaseCeline George
 
BIOCHEMISTRY-CARBOHYDRATE METABOLISM CHAPTER 2.pptx
BIOCHEMISTRY-CARBOHYDRATE METABOLISM CHAPTER 2.pptxBIOCHEMISTRY-CARBOHYDRATE METABOLISM CHAPTER 2.pptx
BIOCHEMISTRY-CARBOHYDRATE METABOLISM CHAPTER 2.pptxSayali Powar
 

Último (20)

Q-Factor HISPOL Quiz-6th April 2024, Quiz Club NITW
Q-Factor HISPOL Quiz-6th April 2024, Quiz Club NITWQ-Factor HISPOL Quiz-6th April 2024, Quiz Club NITW
Q-Factor HISPOL Quiz-6th April 2024, Quiz Club NITW
 
Concurrency Control in Database Management system
Concurrency Control in Database Management systemConcurrency Control in Database Management system
Concurrency Control in Database Management system
 
Beauty Amidst the Bytes_ Unearthing Unexpected Advantages of the Digital Wast...
Beauty Amidst the Bytes_ Unearthing Unexpected Advantages of the Digital Wast...Beauty Amidst the Bytes_ Unearthing Unexpected Advantages of the Digital Wast...
Beauty Amidst the Bytes_ Unearthing Unexpected Advantages of the Digital Wast...
 
INTRODUCTION TO CATHOLIC CHRISTOLOGY.pptx
INTRODUCTION TO CATHOLIC CHRISTOLOGY.pptxINTRODUCTION TO CATHOLIC CHRISTOLOGY.pptx
INTRODUCTION TO CATHOLIC CHRISTOLOGY.pptx
 
4.11.24 Poverty and Inequality in America.pptx
4.11.24 Poverty and Inequality in America.pptx4.11.24 Poverty and Inequality in America.pptx
4.11.24 Poverty and Inequality in America.pptx
 
Man or Manufactured_ Redefining Humanity Through Biopunk Narratives.pptx
Man or Manufactured_ Redefining Humanity Through Biopunk Narratives.pptxMan or Manufactured_ Redefining Humanity Through Biopunk Narratives.pptx
Man or Manufactured_ Redefining Humanity Through Biopunk Narratives.pptx
 
Q-Factor General Quiz-7th April 2024, Quiz Club NITW
Q-Factor General Quiz-7th April 2024, Quiz Club NITWQ-Factor General Quiz-7th April 2024, Quiz Club NITW
Q-Factor General Quiz-7th April 2024, Quiz Club NITW
 
MS4 level being good citizen -imperative- (1) (1).pdf
MS4 level   being good citizen -imperative- (1) (1).pdfMS4 level   being good citizen -imperative- (1) (1).pdf
MS4 level being good citizen -imperative- (1) (1).pdf
 
prashanth updated resume 2024 for Teaching Profession
prashanth updated resume 2024 for Teaching Professionprashanth updated resume 2024 for Teaching Profession
prashanth updated resume 2024 for Teaching Profession
 
Mythology Quiz-4th April 2024, Quiz Club NITW
Mythology Quiz-4th April 2024, Quiz Club NITWMythology Quiz-4th April 2024, Quiz Club NITW
Mythology Quiz-4th April 2024, Quiz Club NITW
 
Narcotic and Non Narcotic Analgesic..pdf
Narcotic and Non Narcotic Analgesic..pdfNarcotic and Non Narcotic Analgesic..pdf
Narcotic and Non Narcotic Analgesic..pdf
 
Multi Domain Alias In the Odoo 17 ERP Module
Multi Domain Alias In the Odoo 17 ERP ModuleMulti Domain Alias In the Odoo 17 ERP Module
Multi Domain Alias In the Odoo 17 ERP Module
 
How to Fix XML SyntaxError in Odoo the 17
How to Fix XML SyntaxError in Odoo the 17How to Fix XML SyntaxError in Odoo the 17
How to Fix XML SyntaxError in Odoo the 17
 
Transaction Management in Database Management System
Transaction Management in Database Management SystemTransaction Management in Database Management System
Transaction Management in Database Management System
 
Student Profile Sample - We help schools to connect the data they have, with ...
Student Profile Sample - We help schools to connect the data they have, with ...Student Profile Sample - We help schools to connect the data they have, with ...
Student Profile Sample - We help schools to connect the data they have, with ...
 
Faculty Profile prashantha K EEE dept Sri Sairam college of Engineering
Faculty Profile prashantha K EEE dept Sri Sairam college of EngineeringFaculty Profile prashantha K EEE dept Sri Sairam college of Engineering
Faculty Profile prashantha K EEE dept Sri Sairam college of Engineering
 
Blowin' in the Wind of Caste_ Bob Dylan's Song as a Catalyst for Social Justi...
Blowin' in the Wind of Caste_ Bob Dylan's Song as a Catalyst for Social Justi...Blowin' in the Wind of Caste_ Bob Dylan's Song as a Catalyst for Social Justi...
Blowin' in the Wind of Caste_ Bob Dylan's Song as a Catalyst for Social Justi...
 
INCLUSIVE EDUCATION PRACTICES FOR TEACHERS AND TRAINERS.pptx
INCLUSIVE EDUCATION PRACTICES FOR TEACHERS AND TRAINERS.pptxINCLUSIVE EDUCATION PRACTICES FOR TEACHERS AND TRAINERS.pptx
INCLUSIVE EDUCATION PRACTICES FOR TEACHERS AND TRAINERS.pptx
 
How to Make a Duplicate of Your Odoo 17 Database
How to Make a Duplicate of Your Odoo 17 DatabaseHow to Make a Duplicate of Your Odoo 17 Database
How to Make a Duplicate of Your Odoo 17 Database
 
BIOCHEMISTRY-CARBOHYDRATE METABOLISM CHAPTER 2.pptx
BIOCHEMISTRY-CARBOHYDRATE METABOLISM CHAPTER 2.pptxBIOCHEMISTRY-CARBOHYDRATE METABOLISM CHAPTER 2.pptx
BIOCHEMISTRY-CARBOHYDRATE METABOLISM CHAPTER 2.pptx
 

Understanding Attitudes and Their Importance

  • 1. INTRODUCTION CHAPTER-1 Attitude: The importance of attitude in understanding psychological phenomenon was given formal recognition early in the history of social psychology. From the time of the concept‟s entry in to the language of psychology until now, interest in attitude has been strong and growing. However, over the years attitudes have been studied with differing emphasis and methods. Concept of Attitude: It is necessary to be precise in defining attitudes, because the variety of published definitions and descriptions is almost endless. Like any other concept, attitude may also be defined in two ways, Conceptual and Operational. There is quite a difference in the conceptual definition of the term attitude, and divergent points of view regarding the concept of attitude have developed. Major aspects: When the term first entered the field of social phenomenon, it was natural to conceive of attitude as a tendency, set or readiness to respond to some social object. For the first time, ALLPORT noted the definition of attitude, which he had observed contained the words „readiness‟, „set‟ or „disposition to act‟. Even ALLPORT has used these terms in defining attitude. He defines attitude as follows: “Attitude is a mental and neural state of readiness organized through experience, Exerting a directive or dynamic influence upon the individual‟s response to all Objects and situations with which it is related” 1
  • 2. Features of Attitude:  Attitudes affect behavior of an individual by putting him ready to respond favorably to things in his environment.  Attitudes are acquired through learning over a period of time. The process of learning attitudes starts right from the childhood and continues throughout the life of a person.  Attitudes are invisible as they constitute a psychologies phenomenon which cannot be observed directly. They can be observed by observing the behavior of an individual.  Attitudes are pervasive and every individual has some kind of attitude towards the objects in his environment. In fact, attitudes are forced in the socialization process and may relate to anything in the environment. Attitude, Opinion and Belief: An opinion is generally the expression of one‟s judgment of a particular set of facts, an evaluation of the circumstances presented to him. “Thurstone” defines opinion „as a response to a specifically limited stimulus, but the response is certainly influenced by the predisposition with, with the individuals operating, that is, the attitude structure. A difference can also be made between attitude and belief. A belief is an enduring organization of perceptions and cognitions about some aspects of individual world. Thus, belief is a hypothesis concerning the nature of objects, more particularly, concerning one‟s judgments of the probability regarding the nature. In this sense, belief is the cognitive component of attitude which reflects the manner in which an object is perceived. The difference between attitude, opinion, and belief exists on conceptual basis Most researchers believe that these three terms are so closely tied that it is difficult to separate them except on a limited conceptual basis. 2
  • 3. In the literature, often, there is a considerable amount of overlapping in these three terms. Most psychologists, however, believe that attitudes are more fundamental to human behavior than are he related aspects. For this reason, more attempts have been made to analyze attitudes as compared to others. Obviously attitudes are an important consideration because of their central position in the process of transforming work requirements in to efforts. Attitude alone do not influence behavior but these acts with other factors in the individual influencing behavior, such as personality, perception, motivation, etc. Further, attitudes are also affected by the individual dimension as well as the objects, persons, and ideas. Attitudes have been through as serving four functions and there by influencing the behavior. These are instrumental, ego defensive, value orientation and knowledge. 1. Instrumental: Attitudes serve as a means to reach a desired goal or to avoid an undesired one. Instrumental attitude are aroused by the activation of a need or cues that are associated with the attitude object and arouse favorable or unfavorable feelings. 2. Ego-Defensive: The ego-defensive functions of attitude acknowledge their importance of psychological thought. Attitude may be acquired by facing threats in the external world or becoming aware of his own unacceptable impulses. 3. Value Orientation: The value-orientation function takes in to account attitudes that are held because they express a person‟s self-image, or by cues that engage the person‟s values and make them salient to him. 4. Knowledge: The knowledge function of attitude is based on a person‟s need to maintain a stable, organized and meaningful structure of the world. 5. Attitude that provides a standard against which a person evaluates the aspects of his world and serve as the knowledge function too. 3
  • 4. These functions of attitudes affect the individual‟s way of interpreting the information coming to him. Since attitudes intervene between work requirements and work responses, information about how people feel about their jobs can be quite useful in the predication about work response. Thus, these types of attitudes can portray areas of investigation for making the individual and the organization more compatible. Factors in Attitude Formation: The attitudes are learned. Though there are different approaches as how learning works and is acquired by an individual, generally it is held that individuals learn things from the environment in which they interact. Thus, for attitude formation, all these factors must be taken in to account from which people learn. Such factors may be analyzed in terms of groups starting from the family as a group, an individual moves in a close group, then to longer groups, and finally to the society as a whole. A part from these groups, the individual‟s psychology which makes up particularly his personality, is also responsible for behavior and attitudes. Methods of Attitude Change: There are various methods through which a positive change in attitudes may be brought. In the social context, Cohen has suggested four methods for attitude change. They are:  Communication of additional information.  Approval and disapproval of a particular attitude.  Group influence, and  Inducing engagement in discrepant behavior. In some or the other, all these methods involve introducing discrepancies among the elements making up the individual‟s attitudes in the hope that the elements will be rebalanced through the effective component of the attitudes. From the organization point of view, a Manager can take following actions in brining change in attitudes of its organizational members. 4
  • 5.  Group action  Persuasion through leadership  Persuasion through communication and  Influence of total situation. These actions involve the analysis of different variables affecting a particular action. Values and Attitudes: Some researchers see values as consisting of large sets of related attitudes. For example, “Fishbein” and “Ajzen” have included two components in attitudes-informational, emotional. Thus, they have taken values as a part of attitudes. However, some differences exist between values and attitudes. Attitudes are specific and related to distinct objects; people, or ideas. Values are more general than attitudes; values often contain statement of goodness or badness associated with the attitudes which people hold. Values are, then, beliefs about which attitudes we should have or how we should behave. Values and Behaviour: Behaviour of people is influenced by the values which they hold, particularly in terms of those stimuli which have some value orientation in the organizational context, understanding the influence of individual value system on the behaviour of individuals in the following manner:  Values influence an individual perception about the problems he faces and consequently the decision he makes to overcome those problems.  Values influences the way in which an individual looks at the other individual and groups of individuals, that is, interpersonal relationship. Values become the basis of such interpersonal relationship interactions. 5
  • 6.  Individuals judge organizational success as well as its achievement of the basis of their value system. Thus, for some individuals, organizational success may be in the form of high profit earning irrespective of the means adopted whereas, this may be a mean thing for other individuals.  Individuals set limit for the determination of what is ethical or unethical behaviour for themselves as well as for the others.  Values determine the extent to which individuals accept organizational pressures and goals. If these do not match with the value held by them, they thwart the organizational pressures and goals, and even leave the organization. Employees’ Attitudes towards the Organization: Attitudes are not the same as values, but the two are interrelated. You can see this by looking at the three components of an attitude: cognition, affect and behavior. The belief that “discrimination is wrong” is a value statement. Cognitive Component of an Attitude: It sets the stage for the more critical part of an attitude and is reflected in the evaluative statements concerning objects, people or events. The behavioral component of an attitude refers to an intention to behave in a certain way towards someone or something. In organizations, attitudes are important because they affect job behaviour. If workers believe, for example, that superiors, auditors, bosses, and time-and motion engineers are all in conspiracy to make employees work harder for the same or less money, and then it makes sense to try to understand how these attitudes were formed, their relationship to actual job behaviour, and how they might be changed. 6
  • 7. Types of Attitudes: A person can have thousands of attitudes, but Organizational Behaviour focuses our attention on a very limited number of work-related attitudes. These work-related attitudes tap positive or negative evaluations that employees hold about aspects of their work environment. Most of the research in OB has been concerned with three attitudes: job satisfaction, job involvement, and organizational commitment. Job Satisfaction: The term job satisfaction to an individual‟s general attitude towards his or her job. A person with a high level of job satisfaction holds positive attitudes about their job, while a person who is dissatisfied with his or her job holds negative attitudes about the job. When people speak of employee attitudes, more often mean job satisfaction. Job Involvement: The term job involvement is a more recent addition to the OB literature while there isn‟t complete agreement over what the tem means. A workable definition states that job involvement measures the degree to which a person identifies him with his or her job and considers his or her perceived performance level important to self-worth. Employees with a high level of job involvement strongly identify with and really care about the kind of work they do. Organizational Commitment: The third job attitude is organizational commitment, which is defined as a state in which an employee identifies with a particular organization and its goals, and wishes to maintain membership in the organization. So, high job involvement means identifying with one‟s specific job, while high organizational commitment means identifying with one‟s employing organization. 7
  • 8. Attitudes and Consistency: Research has generally concluded that people seek consistency among their attitudes and between their attitudes and their behaviour. This means that individuals seek to reconcile divergent attitudes and align their attitudes and behaviour so that they appear rational and consistent. When there is an in consistency, forces are initiated to return the individual to an equilibrium state. Cognitive Dissonance Theory: This theory sought to explain the linkage between attitudes and behaviour. Dissonance means an inconsistency. Cognitive dissonance refers to an incompatibility that an individual might perceive between two or more of his or her attitudes, or between his or her behaviour and attitudes. Moderating Variables: The most powerful moderates have been found to be the importance of the attitude specially its accessibility, whether there must exist social pressures, and whether a person has direct experience with the attitude. Important attitudes are one‟s that reflect fundamental values, self-interest, or identification with individuals or groups that a person values. Attitude that individuals consider important tend to show a strong relationship to behavior. Attitude Survey: The preceding review indicates that knowledge of employee attitudes can be helpful to managers in attempting to predict employee behaviour. But, how does management get information about employee attitudes. The most popular methods are through the use of attitude surveys. 8
  • 9. Attitude and Workforce Diversity: Managers are increasingly concerned with changing employee attitude to reflect shifting perspectives on racial, gender, and other diversity issues. A comment to a co-worker of the opposite sex, which 20 years ago might have been taken as a complaint, can today become a career-limiting episode. The majority of large U.S. employees and a substantial proportion of medium sized and smaller ones sponsor some sort of diversity training. Some examples are, Police Officers in Escondido, California, receive 36 hours of diversity training for their 12,000 employees. The Federal Aviation‟s Administration sponsors amendatory 8 hours diversity seminar for employees of its western pacific region. Job Satisfaction: Job satisfaction is one of the important factors which have drawn attention of managers in the organization as well as academicians Various studies have been conducted to find out the factors which determine job satisfaction and the way it influences productivity in the organization. Though, there is no conclusive evidence that job satisfaction affects productivity directly because productivity depends on so many variables, it is still a prime concern for managers. Job satisfaction is the mental feeling of favorableness which an individual has about his job. “Dubrins” has defined job satisfaction in terms of pleasure and contentment when he says that. Determinants of Job Satisfaction: While analyzing various determinants of job satisfaction, we have to keep in mind that all individuals do not receive the same degree of satisfaction though they perform the same job in the same job environment and at the same time. Therefore, it appears that besides the nature of job and job environment, there are individual variables which affect job satisfaction. Thus all those factors which provide a fit among individual variables, nature of job and situational variables determine the degree of job satisfaction. Let us see what these factors are: 9
  • 10. Individual Factors: Individuals have certain expectation from their jobs. If there expectations are met from the jobs, they feel satisfied. These expectations are based on an individual‟s level of education, age, and other factors. 1. Level of Education: Level of education of an individual is a factor which determines the degree of job satisfaction. For example, several studies have found the negative correlation between the level of education, particularly higher level of education and job satisfaction. 2. Age: Individuals experience different degrees of job satisfaction at different stages of their life. Job satisfaction is high at the initial stage, get gradually reduced, starts rising up to certain stage and finally dips to a low degree. 3. Other factors: Besides the above two factors, there are other individual factors which affect job satisfaction. If an individual does not have favorable social and family life, he may not feel happy at the work place. Similarly, other personal problems associated with him may affect his level of job satisfaction. Effect of his Job Satisfaction: Job satisfaction has a variety of effects. The effects may be seen in the context of an individual‟s physical and mental health, productivity, absenteeism, and turnover. 10
  • 11. Physical and Mental Health: The degree of job satisfaction affects an individual‟s physical and mental health. Since, job satisfaction is a typed of mental feeling, its favorableness or unfavourableness affects the individual psychologically which for example, “Lawler” has pointed out that drug abuse, alcoholism, and mental and physical health results from psychologically harmful jobs. Improving Job Satisfaction: Job satisfaction plays a significant role in the organization. Therefore, Managers should take concrete steps to improve the level of job satisfaction. These steps may be in the form of job re-designing to make the job more interesting and challenging, improving quality of work life, linking rewards with performance, and improving overall organizational climate. Attitude Measurement: Attitudes are subjective attributes of people. They can be regarded as construct in the sense that they are conceptualizations of human qualities that are formed on the basis of either rational consideration or statistical evidence. Thus, people may vary along a number of attitudinal dimensions. Keeping this measurement aspect in to consideration, the attitudes might be defined operationally by describing the measurement systems that psychologists use to measure attitudes. Attitude measurement, developed largely by social psychologists is concerned with the efforts to tap these attitudes as they are characteristics of individuals. There are many methods of attitude measurement. The Thurston type of scaling goes back to the early work of Thurston and Chive, which collected a large number of statements relating to the area in which attitudes were to be measured. This statement may be relating to any object about which attitudes were to be measured. The statements are both favorable and unfavorable and are placed in 11 piles, with most favorable one being placed in pile 11. Other statements are placed in between their position depending on the degree of favorability or unfavorability. The scale is then presented to the 11
  • 12. respondents. Each respondent checks the statement in pulling together numerous methods dealings with attitude measurement. They are:  Self-Report  Indirect Tests  Direct Observation Techniques  Psychology Reaction Techniques However attitude measurement of employees in an organization is most commonly carried out with self-respect questionnaires uses several scaling methods. There are three types of attitude scaling which are commonly used in attitude measurement. They are Thurston type of scale, Liker scale, and semantic differential. With which he agrees his attitude score is then based on the average or the median scale of the statements that he has checked. Soon after Thurston scale, Likert experimented with certain other varieties of attitude scales. Likert‟s attitude scale uses five points. The statements relating to the measurement of attitude is given to the person concerned and he is asked to check one of the five points given for every statement. These points show the degree of agreement or disagreement with the statement. The Likert scale is considered better as compared to Thurston because of several positive facts. For example, in this scaling, there is no much problem in making numerous statements which will show both positive and negative degree. The semantic differential, an attitude scaling technique that lends itself to various applications, was developed by Orgood, Suci and Tannenbaum. Therefore, an employee who has a high level of job satisfaction tends to bear attitudes, which are favorable to the organization. Balancing the positives with the negatives is important so that the employees will not be disappointed and become a problem that would have been avoided from the beginning. Attitudes cannot be changed drastically or quickly. There is a reason why people have attitudes; it is a part of them. To change a person takes patience and lots and lots of stalls, especially in a boss-employee relationship where it is more formal. Sometimes, all it takes is a warning in simple words which is to change an unfavorable attitude. 12
  • 13. When an employee discloses a mental health problem, try to work out a reasonable accommodation. Give him/her time off from work or a modified work schedule, make physical changes to the work place, or adjust supervisory instructions or training. Many mental health problems are highly treatable and cause only temporary disruptions at work. If an employee with a chronically negative attitude suddenly claims a mental disability, employers have the right to ask for medical certification and/or, in some situations, a second opinion. However, credible testimony from a family member may be enough, and asking for more may be an invasion of privacy. Check with an attorney before requesting these. Strike before the iron gets hot by including conduct problems in your employee hand book. Develop a policy that clearly delineates the types of behavior which are not acceptable in your workplace. The above mentioned examples are some which can change unfavorable attitude to a favorable one. 13
  • 14. PRISIDENCY KID LEATHER LIMITED COMPANY PROFILE This closely held leather company in existence since 1972 consists of a leather division, a shoe upper division and a full shoe division. The company derives enormous pride and satisfaction from the fact that the customer relationships are everlasting due to the consistency maintained in its very high quality standard of leathers, shoe uppers and shoes. Elegance and finesse is the hallmark of the glazed kid leathers. Beautifully crafted from a variety of leathers, the Shoe Uppers & Shoes are based on detailed information gathered from the clients. The company's policy is to understand the requirements of its customers accurately and come up with the right product, in the right leather at an attractive price. Customer profile of the company includes the best factories in Germany, Holland, England, Italy, France, U.S.A and the Far East. The company's management board consists of a chairman and 5 directors INFRASTRUCTURE The state-of-the-art manufacturing facility of PKL is located at a place that is well connected, and easily accessible. The area is renowned for leather and shoe manufacturing; hence skilled labour is available in abundance. Captive power and generating sets ensure uninterrupted production. Modern communication facilities like Internet, E-mail link to all the manufacturing facilities and Head Office 14
  • 15. MANPOWER The tannery employs 300 workers and 100 trained technical staff with an annual production capacity of Fifteen million square feet of Kid, Sheep and Calf Leathers in a built up area of 16,000 square meters. Renowned for its glazed kid leathers using the best Indian Raw Material, the Tannery is equipped with a modern Effluent Treatment Plant. The shoe division of the company employs around 1200 workers, 40 technical personnel, executives and managers to ensure that quality requirements and delivery schedules are met. The fully automated plant is managed by highly skilled staff, right from cutting to final production to meet the global demand of increasingly high standards with an annual manufacturing capacity of 1.2 million pairs of shoe uppers and 3,00,000 pairs of shoes. Shoe Upper Division: Customer satisfaction is extremely important to us. Hence, we place great emphasis on research, design and quality to ensure their total satisfaction. We use the best and most appropriate leathers. Production Capacity: Two units with a total capacity of 12,00,000 pairs a year making both Ladies and Gents uppers. Tannery & Finished Leather Division The tannery, with an annual production capacity of fifteen million square feet of kid, sheep and calf leathers in a buildup area of 16,000 square meters, employs 300 workers and 100 trained technical personnel. Renowned for its glazed kid leathers, produced by using the best Indian raw material, the tannery is equipped with a modern effluent treatment plant. 15
  • 16. Finished Leather 1) Kid Leathers: Glazed and Polished Finishes Chrome and Vegetable Re-tanned 2) Sheep and Lamb Cabrettas 3) Calf Leathers: Glazed and Polished Leathers Full Shoes division With constant technical inputs and access to the latest technology our products are in a class by themselves. Total commitment to quality, service and delivery schedule is to the total satisfaction of our valued clients. Our exotic collection of leather shoes reflects a contemporary trend in fashion worldwide. Each one is subtly handcrafted by skilled artisans and custom-made to impress the most fastidious buyers. Production capacity of 3, 00,000 pairs a year. 16
  • 17. PRODUCT PROFILE PKL Leather Industry The Presidency kid‟s Limited industry occupies a place of prominence in the Indian economy in view of its massive potential for employment, growth and exports. There has been an increasing emphasis on its planned development, aimed at optimum utilization of available raw materials for maximizing the returns, particularly from exports. The exports of leather and leather products gained momentum during the past two decades. There has been a phenomenal growth in exports from Rs.320 million in the year 1965-66 to Rs.69558 million in 1996-97. Indian leather industry today has attained well merited recognition in international markets besides occupying a prominent place among the top seven foreign exchange earners of the country. The leather industry has undergone a dramatic transformation from a mere exporter of raw materials in the sixties to that of value added finished products in the nineties. Policy initiatives taken by the Government of India since 1973 have been instrumental to such a transformation. In the wake of globalization of Indian economy supported with liberalized economic and trade policies since 1991, the industry is poised for further growth to achieve greater share in the global trade. Apart from a significant foreign exchange earner, leather industry has tremendous potential for employment generation. Direct and indirect employment of the industry is around 2 million. The skilled and semi-skilled workers constitute nearly 50% of the total work force. The estimated employment in different sectors of leather industry is as follows: 17
  • 18. Structure of the industry The leather industry is spread in different segments, namely, tanning & finishing, footwear & footwear components, leather garments, leather goods including saddler & harness, etc. The estimated production capacity in different segments is as under Product Capacity Leather Hides 64 million pieces Skins 166 million pieces Footwear & Footwear Components a) Shoes 100 million pairs b) Leather shoe uppers 78 million pairs c) Non-leather shoes/Chappals etc. 125 million pairs Leather Garments 6 million pieces Leather Products 70 million pieces Industrial Gloves 40 million pairs Saddlery 6000 pieces The major production centers for leather and leather products are located at Chennai, Ambur, Ranipet, Vaniyambadi, Trichi, Dindigul in Tamil Nadu, Calcutta in West Bengal, Kanpur in Uttar Pradesh, Jalandhar in Punjab, Bangalore in Karnataka, Delhi and Hyderabad in Andhra Pradesh. 18
  • 19. Raw material supplies There exists a large raw material base. This is on account of population of 194 million cattle, 70 million buffaloes, and 95 million goats. According to the latest census, India ranks first among the major livestock holding countries in the world. In respect of sheep with 48 million sheep‟s, it claims the sixth position. These four species provide the basic raw material for the leather industry. The annual availability of 166 million pieces of hides and skins is the main strength of the industry. This is expected to go up to 218 million pieces by the end of year 2000. Some of the goat/calf/sheep skins available in India are regarded as specialty products commanding a good market. Abundance of traditional skills in training, finishing and manufacturing downstream products and relatively low wage rates are the two other factors of comparative advantage for India. Tanning and finishing capacity With tanning and finishing capacity for processing 1192 million pieces of hides and skins per annum spread over different parts of the country, most of which is organized along modern lives, the capability of India to sustain a much larger industry with its raw material resource is evident. In order to augment the domestic raw material availability, the Government of India has allowed duty free import of hides and skins from anywhere in the world. It is an attraction for any foreign manufacturer who intends to shift his production base from a high cost location to low cost base. Export Potential The leather industry, one of the major foreign exchange earners of the country recorded significant growth since the beginning of the decade. Today the share of the value added finished products in the total exports from leather sector are 80% as against 20% in 1970s. 19
  • 20. Top ten Indian leather exporters Tata International Ltd. Florind Shoes Ltd. Punihani International Farida Shoes Ltd. Mirza Tanners Ltd. T. Abdul Wahid & Company Hindustan Lever Ltd. Super House Leather Ltd. RSL Industries Ltd. Presidency Kid Leather Ltd. Pkl Leather Footwear Industry India is the world's second largest producer of footwear; its production estimated over 700 million pairs per annum. At about US $ 300 million per year, footwear accounts for 18 percent share of total exports of leather exports. Various types of shoes produced and exported from India include dress shoes, casuals, moccasins, sports shoes, horacchis, sandals, ballerinas, and booties. Major production centers are Chennai (Madras), Delhi, Agra, Kanpur, Mumbai (Bombay), Calcutta and Jalandhar. Most of the modern footwear manufacturers in India are already supplying to well establish brands in Europe and USA. The large domestic market and the opportunity to cater to world markets make India an attractive destination for technology and investments. Equally relevant is it for the footwear components industry, at this juncture, it is posed for real growth and diversification. 20
  • 21. PKL Leather Goods Industry Items produced by this sector include, in addition to bags, handbags, hand gloves and industrial gloves, wallets, ruck sacks, folios, brief cases, travel ware, belts, sports goods, upholstery and saddlery goods. A surfeit of modern units in Chennai, Kanpur and Calcutta employing skilled human resources and equipped with modern and sophisticated machinery account for a diversified range of superlative small leather goods including bags, purses, wallets, industrial gloves etc. made of quality leathers of cows, sheep, goats and buffaloes. The products meet the requirement of bulk buyers and consumers in Europe, USA and Australia. The major market for Indian leather goods is Germany, with an off take of about 25 per cent of the leather goods produced in India followed by USA, UK, France and Italy. With products ranging from designer collections to personal leather accessories, this sector has a share of 20.53 per cent in the leather industry, while maintaining an average growth rate of 11 per cent recorded in the last five years. PKL Leather Garments Industry The Leather Garment Industry occupies a place of prominence in the Indian leather sector. The product classification of leather garments comprise of jackets, long coats, waist coats, shirts, pant/short, children garments, motorbike jackets, aprons and industrial leather garments. Indian leather garments, which entered the world market only in the mid-eighties with exports of Rs. 15 crores in 1997-98, account for about Rs. 1530 crore in 1997-98. The major export destination of leather garments from India is Germany. In 1997, German imports of leather garments aggregated DM 1786 million of which DM 304 million worth of imports went from India. India, China and Turkey were the major suppliers of leather garments for the German market, as they accounted for about 78% of the market share. 21
  • 22. Among the three major exporting nations of leather garments, India maintains a similar level of market share of about 20%, in both German and EU markets. Other markets for India include Italy, U.K., U.S.A. France, Spain and Netherlands. Recently, successful attempt had been made for exports to Denmark, Switzerland and Canada. PKL Leather Industry - Investment & Sales The ratio of investment: sales value is 1: 2.25, which is very low when compared to other industries. This is mainly due to low capacity utilization of the units. The capacity utilisation of units in respect of hides converting raw into unfinished leathers is estimated at 49%, raw to finished 60% and unfinished to finished 70%. In the case of skin based tanneries, the respective percentages are 64, 67 and 70. The main reasons reported for under utilisation of capacity are raw material shortage, high price of raw materials, and lack of modernization, financial constraints, power constraints and stringent environmental regulations. Marketing of leather and leather products in Germany & the EU The leather sector offers a good potential which Indian entrepreneurs can exploit in Germany and other EU markets characterised by ever growing competitiveness in terms of price and quality, on one hand, and the environmental considerations, on the other. With a strong foothold that the Indian leather industry has had for long in these markets, and its advantage of raw material and labour resources, Indian leather exporters can, and should, mount a concerted marketing campaign to wrest a share consistent with their inherent strength and potential. This has to be done against the background of the well-known salient features of the German market: 22
  • 23. The world's second largest import and export market  A difficult buyers' market with hyper competition and high expectations  A dynamic multi-faceted market with rapid technological development and innovations A market where a considerable amount of buying power is devoted to satisfying individual needs  A market influenced by the rising average age of the population and low birth rate  A market where environment awareness and eco-friendly production becomes more and more a pre-requisite for successful marketing of products Marketing channels The emerging trend in Germany has been towards direct imports. The other noteworthy feature is the integration of retailing and manufacturing, particularly for the footwear sector. This has led to increased emphasis on distribution aspects of business. Other distributors, like departmental stores, mail order houses, super markets and non-leather shops have also gained importance. Many outlets get direct supplies either from the manufacturers and importers or from wholesalers and buying associations (Einkaufs- Verband, e.V.). These developments necessitate the marketing strategies to be attuned to the specifics of the different channels, keeping in sharp focus the changes taking place in the distribution pattern of chain stores, retailers, discounters, etc. The strategy should focus on a structural approach to the promotion of export of leather products from India. This must include market information for exploring new markets, participation in different international trade fairs, organizing trade delegations, organizing buyer- seller meets, liaising with the representatives of the buying houses, etc. 23
  • 24. OBJECTIVES OF STUDY • To know the employees‟ attitude towards the organization • To know the reasons for the employees‟ positive attitude • To know the reasons for the employees‟ negative attitude • To know the employees‟ expectations from the organization • To make suggestions to improve the attitude of the employees to the management. 24
  • 25. SCOPE OF STUDY  Monitor transition from a previously owned proprietorial business to a subsidiary business.  Measure the effects of company management over the previous two years.  Monitor the organization‟s current state of maturity.  Monitor the effects of personnel, policy, and strategy changes.  Monitor the effects of market changes. 25
  • 26. LIMITATION LIMITATION OF THE STUDY  Only 100sample size has been taken for this study. So, if this study is conducted to maximum persons, it may give accurate overall attitude of the employees.  It is done in PKL LEATHER LIMITED, so it cannot resemble the entire population working in the whole industry.  Time was a major limitation for our study.  Some people did not respond properly for the questionnaire clearly. 26
  • 27. RESEARCH METHODOLOGY RESEACH METHODOLOY Four types of studies can be called research namely reporting, description, explanation and prediction can be called research. Cooper and Emory (1995:21) define research as a systematic enquiry aimed at providing information to solve problems. Organization normally support business research for one research ie is to obtain competitive advantage. SAMPLE SIZE: Population : 500 Unit : Management Sample size : 100 RESEARCH STUDY: In this study “EMPLOYEE ATTITUDE” the design chosen for the study is descriptive in nature. As the study is find out the employees opinion about the training programs and their views and ideas to improve the training facilities. SAMPLING The technique adapted for the sample was disproportionate stratified sampling. From the universe, selected samples from various departments are chosen. Thus, samples were selected for study and hence the sampling technique used was disproportionate stratified technique. 27
  • 28. SOURCES OF DATA: PRIMARY DATA The primary source include the actual information received directly concerned with the problem of study. The researcher primarily collected the data about the employee attitude towards the organization. The primary sources are mainly the general knowledge that research knows about the topic and the respondents who provide sufficient information about the topic. SECONDARY DATA: Secondary data are the information, which are attained indirectly. It‟s not attained directly from the employees. The secondary sources of information include the publicized, unpublished documents and other such types of information. The public document such as books, manuscripts, reports, records, papers and magazines are for secondary data collection. DATA COLLECTION TOOLS: The tools needed for the data collection was questionnaire. The questionnaire containing 20 questions was used to collect data from the employees. The resources for choosing the questionnaire collection of data is the respondents will easy to answer the questions which choice rather than asking them to write own. Every lesser time is required for answering the questions. The respondents express their views in a clear manner by the survey. PERIOD OF THE STUDY The study was conducted from 1 December to 30 December which altogether comprises of one month. RESEARCH DESIGN The research carried out the study with the descriptive type of research. 28
  • 29. TARGET STUDY The target study confined to the researcher is PRISIDENCY KID LEATHER LTD, GUDUVANCHERRY Works employees based on their evaluation of Employee attitude Though EMPLOYEE ATTITUDE is given in almost all the organization, but only a few organizations such as ltd takes its priority in organizing attitude programs & evaluating the programs with continuous analysis for the development & upliftment of the employee‟s skills & attitudes SAMPLE DESIGN For this study two different types on non probability sample design were used. • CONVENIENCE SAMPLING This designs aims at the collection of information from any convenient group whose views are relevant to the subject of study. JUDGEMENT SAMPLING The second sampling used was the judgment technique, Where the group to be interviewed was selected in advance by the judgment of the experts, within the organization TOOLS USED FOR THE DATA ANALYSIS For the purpose of analysis and interpretation certain common methods were used through diagrammatic representation like pie diagram and data collected by the questionnaire method and data analysis in percentage analysis. It is a descriptive type of study . 29
  • 30. RESEARCH DESIGN It is the specification of the methods and procedures for acquiring the information needed to structure or to solve problems. It stands for advance planning of the methods to be adopted for collecting relevant date and the techniques to be used in their analysis, keeping in view the objectives of the research. Two types of research design were used for this study:- 3.12.1 EXPLORATIVE STUDY First an explorative study was undertaken, with an aim at gaining familiarity, or with an aim at achieving insights into the study, which dealt with the formulation of a more precise research problem . it was basically a pilot study which was undertaken before actual research. The aims of this design was limited to 1 Gathering the various secondary sources of information. 2 Interview schedules with experts, to gather their insights and views about the study 3 Analysis of the various causes related to their study 30
  • 31. DESCRIPTIVE STUDY The second design used for this study was the descriptive study; the reason for using this design was to acquire knowledge in a detailed manner. This study basically aims at portraying the characteristics of the individuals and firms in a detailed manner, to find out the root cause analysis for the employee attitude evaluation and development in creating knowledge skills for the employees. ORGANISING AND CONSTRUCTING THE FIELD STUDY The next stage, was to carry out a field survey, for this the personal interview method was undertaken so the necessary information could be collected from the respondents. 31
  • 32. TABLE - 8.1 SKILL DETAILS S.NO OPINION NO.OF.RESPONDENTS PERCENTAGE 1 Agree 74 74 2 Disagree 6 6 3 Partially agree 20 20 Total 100 100 INFERENCE: From the above the 74% of the respondents are „Agree‟ that the job is enables them to develop their skills .20% of the respondents „Partially Agree‟ that the job enables them to develop their skills, but remaining 6% of respondents „Disagree‟ that the job is not helpful to develop their skills. 32
  • 33. CHART-8.1 SKILL DETAILS 74 80 70 60 50 40 20 30 20 6 10 0 AGREE DISAGREE PARTIALLY AGREE . 33
  • 34. TABLE-8.2 LENGTH OF SERVICE S.NO OPINION NO.OF.RESPONDENTS PERCENTAGE 1 0-2 years 30 30 2 3-4 years 40 40 3 4-5 years 14 14 4 more than 10 16 16 years Total 100 100 INFERENCE: From the above it is clear that 40% of the Respondents says that they are working around „3-4 years‟ in the company .30% of Respondents are working between „0-2 years‟ in the company.16% of the Respondents are senior of the company .14% of the respondents says that „5-10‟ years they are working in a company. 34
  • 35. CHART-8.2 LENGTH OF SERVICE 40 40 30 35 30 25 16 14 20 15 10 5 0 0-2 years 3-4 years 4-5 years more than 10 years 35
  • 36. TABLE -8.3 FAMILY DETAILS S.NO OPINION NO.OF.RESPONDENTS PERCENTAGE 1 1 20 20 2 2 40 40 3 3 24 24 4 Above 3 16 16 Total 100 100 INFERENCE: From the above table it is clear that 40% of the respondents says that „2 members‟ of their family depend on them .24% of the respondents says „3 members‟ of their family depend on them . 20% of the respondents says „1 member‟ of their family depend on them. Only 16% of members says above „4 members‟ of their family depend on them. 36
  • 37. CHART-8.3 FAMILY DETAILS 45 40 40 35 30 24 25 20 20 16 15 10 5 0 1 2 3 Above 3 1 2 3 4 37
  • 38. TABLE -8.4 ACCEPTANCE OF CHANGING CONDITION S.NO OPINION NO.OF.RESPONDENTS PERCENTAGE 1 Yes 80 80 2 No 20 20 Total 100 100 INFERENCE: From the above that it is clear that 80% of the respondents have said „YES‟ because they are able to adapt to themself to the changing conditions or unexpected obstacles in the organization. But 20% of respondents said „NO‟ for that they are not able to adapt to themself to the changing conditions or unexpected obstacles in the organization. 38
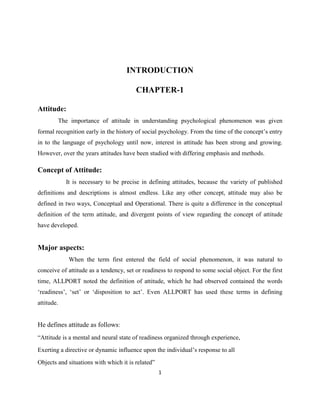
  • 40. TABLE-8.5 STRESS DETAILS S.NO OPINION NO.OF.RESPONDENTS PERCENTAGE 1 Agree 30 30 2 Disagree 70 70 Total 100 100 INFERENCE: From the above table it is clear that 70% of the respondents „Disagree‟ that they do not undergo stress when changes are preferred. 30% of the respondents agree that they undergo stress when change are preferred . 40
  • 41. CHART-8.5 STRESS DETAILS 80 70 70 60 50 40 30 30 20 10 0 Agree disagree 1 2 41
  • 42. TABLE-8.6 OPTIMISTIC BEHAVIOUR S.NO OPINION NO.OF.RESPONDENTS PERCENTAGE 1 Yes 66 66 2 No 34 34 Total 100 100 INFERENCE: From the above table 66% of respondents says „Yes‟ that they are able maintain intensity and remain optimistic and persistent even under adversity . 34% of respondents says „No‟ for they are not maintain intensity and remain optimistic and persistent under adversity. 42
  • 43. CHART-8.6 OPTIMISTIC BEHAVIOUR 66 70 60 50 34 40 30 20 10 0 Yes No 43
  • 44. TABLE-8.7 ABILITY IS SET PRIORITIES AND ANTICIPATE PONTENTIAL THERATS OR OPPORTUNITIES S.NO OPINION NO.OF.RESPONDENTS PERCENTAGE 1 Yes 74 74 2 No 26 26 Total 100 100 INFERENCE: From the above table 74% of respondents says „Yes‟ as they are ready to give priorities and anticipate potential threats or opportunities in an organisation. But remaining 26% says „No‟ as they are not able to adapt set priorities and anticipate potential threats or opportunities. 44
  • 45. CHART-8.7 ABILITY IS SET PRIORITIES AND ANTICIPATE PONTENTIAL THERATS OR OPPORTUNITIES 80 74 70 60 50 40 30 26 20 10 0 Yes No 1 2 45
  • 46. TABLE-8.8 VISION SHARING DETAILS S.NO OPINION NO.OF.RESPONDENTS PERCENTAGE 1 Yes 76 76 2 No 24 24 Total 100 100 INFERENCE: From the above table 76% of respondents says „Yes‟ for they are share vision with others influences other to translate vision into action but remaining 24% have reject the statement. 46
  • 48. TABLE-8.9 ABILITY TO RESLOVE CONFLICT S.NO OPINION NO.OF.RESPONDENTS PERCENTAGE 1 Strongly disagree 10 10 2 disagree 20 20 3 Agree 40 40 4 Strongly agree 30 30 Total 100 100 INFERENCE: From the above table 40% of respondents „Agree‟ to resolves Conflicts in a positive manner. Remaining 30% of respondents „Strongly agree‟ to resolves in positive manner. 20% of respondents „Disagree‟ with this statement.10% respondents strongly disagree that conflicts of positive and constructive manner to minimize negative impact. 48
  • 49. CHART-8.9 ABILITY TO RESLOVE CONFLICT 40 40 30 35 30 25 20 20 10 15 10 5 0 Strongly disagree disagree Agree Strongly agree 49
  • 50. TABLE-8.10 GOAL ACCOMPLISHMENT S.NO OPINION NO.OF.RESPONDENTS PERCENTAGE 1 Strongly Disagree 16 16 2 Disagree 14 14 3 Agree 20 20 4 Strongly agree 50 50 Total 100 100 INFERENCE: From the above table 50% of respondents „Strongly agree‟. That the company inspire/motivate & guide others towards goal. Remaining 20% „Agree‟ with this statement .16% have „Strongly Disagree‟ statement .Remaining14% of respondents „Disagree‟ with this statement. 50
  • 51. CHART-8.10 GOAL ACCOMPLISHMENT Strongly agree 50 Agree 20 disagree 14 Strongly disagree 16 0 5 10 15 20 25 30 35 40 45 50 51
  • 52. TABLE-8.11 DETAILS OF PERSON TO BE RELIED S.NO OPINION NO.OF.RESPONDENTS PERCENTAGE 1 Yes 60 60 2 No 40 40 Total 100 100 INFERENCE: From the table indicates that 60% respondents says „Yes‟ for they are person on whom someone can rely to carry out tasks effectively . Remaining 40% respondents says „No‟ for this statement 52
  • 53. CHART-8.11 DETAILS OF PERSON TO BE RELIED 60 60 40 50 40 30 20 10 0 Yes No 53
  • 54. TABLE-8.12 ABILITY TO TAKES UP RESPONSIBILITY S.NO OPINION NO.OF.RESPONDENTS PERCENTAGE 1 Yes 56 56 2 No 44 44 Total 100 100 INFERENCE From the above table 56% of the respondents says „yes‟ for they are satisfied that responsibility are complete in a timely manner and within budget . Remaining 40% of respondents say „No‟. 54
  • 55. CHART- 8.12 ABILITY TO TAKES UP RESPONSIBILITY 55
  • 56. TABLE-8.13 ABILITY TO SATISFY NEEDS OF CLIENTS S.NO OPINION NO.OF.RESPONDENTS PERCENTAGE 1 Yes 82 82 2 No 18 18 Total 100 100 INFERENCE: From the table indicates that 82% of respondents are says „Yes‟ for they are able to the client‟s needs to develop the business. Remaining 18% of respondents say that it is not necessary 56
  • 57. CHART-8.13 ABILITY TO SATISFY NEEDS OF CLIENTS 57
  • 58. TABLE-8.14 ABILITY TO TAKE TIMELY DECISIONS S.NO OPINION NO.OF.RESPONDENTS PERCENTAGE 1 Strongly disagree 8 8 2 disagree 12 12 3 Agree 56 56 4 Strongly agree 24 24 Total 100 100 INFERENCE: From the above table it is inferred that 56% of the respondents „Agree‟ that the company makes effective and timely decisions , even the data is limited the solutions produce un pleasant consequences. 24%of the respondents „Strongly agree‟ the company makes effectives and timely decisions , even the data is limited the solutions produce un pleasant consequences.12% of the respondents „Disagree‟ that the company does not make effective and timely decision even data is limited or solutions produce un pleasant consequences. 8% of the respondents „Strongly disagree‟ that the company make effective and timely decision even data is limited or solutions produce un pleasant consequences. 58
  • 59. CHART-8.14 ABILITY TO TAKE TIMELY DECISIONS 56 60 50 40 24 30 12 20 8 10 0 Strongly disagree Agree Strongly disagree agree 59
  • 60. TABlE-8.15 ABILITY TO DISTINGUISH RELEVANT AND IRRELEVANT S.NO OPINION NO.OF.RESPONDENTS PERCENTAGE 1 Strongly disagree 16 16 2 disagree 12 12 3 Agree 48 48 4 Strongly agree 24 24 Total 100 100 INFERENCE: From the above table it is clear that 48% of the respondents „Agree‟ that they are able to make logical decisions relevant & irrelevant information. 24% of the respondents „Strongly agree‟ that they are able to make logical decisions on relevant & irrelevant information. 16% of the respondents „Strongly disagree‟ that they are not able to make logical decisions and irrelevant.12% the respondents „Strongly disagree‟ that they are not able to make logical decisions and irrelevant. 60
  • 61. CHART-8.15 ABILITY TO DISTINGUISH RELEVANT AND IRRELEVANT 61
  • 62. TABLE-8.16 REWARD FOR HARDWORK DETAILS S.NO OPINION NO.OF.RESPONDENTS PERCENTAGE 1 Yes 70 70 2 No 30 30 Total 100 100 INFERENCE: From the above table 70% of the respondents says „Yes‟ that they are rewarded for that hard work .Remaining 30% says „No‟ for this statement 62
  • 63. CHART- 8.16 REWARD FOR HARDWORK DETAILS 63
  • 64. TABLE- 8.17 PROMOTION DETAILS S.NO OPINION NO.OF.RESPONDENTS PERCENTAGE 1 Strongly disagree 6 6 2 disagree 14 14 3 Agree 46 46 4 Strongly agree 34 34 Total 100 100 INFERENCE: From the above table 46% of the respondents „Agree‟ that job promotions with in the company fair and reasonable. 34% of the respondents „Strongly agree ‟ that job promotions with in the company is not fair and reasonable. 14% of the respondents „disagree‟ that job promotions with in the company is not fair and reasonable. 6% of the respondents „Strongly disagree‟ that job promotions with in the company fair and reasonable. 64
  • 66. TABLE- 8.18 DEMOTION /INCREMENT DETAILS S.NO OPINION NO.OF.RESPONDENTS PERCENTAGE 1 Yes 72 72 2 No 28 28 Total 100 100 INFERENCE: From the above table it is clear that 72% of the respondents says „Yes‟ for the increment on letter performance and demotion on job improper performance. Remaining 28% say „No‟ for this statement . 66
  • 67. CHART-8.18 DEMOTION /INCREMENT DETAILS 72 80 70 60 50 40 28 30 20 10 0 Yes No 67
  • 68. TABLE -8.19 ABILITY TO DEVLOP NEW AND MAN EFFICIENCY S.NO OPINION NO.OF.RESPONDENTS PERCENTAGE 1 Strongly disagree 20 20 2 disagree 12 12 3 Agree 48 48 4 Strongly agree 20 20 Total 100 100 INFERENCE: From the above table 48% of people „Agree‟ that they are encouraged to develop new and more efficient ways to do their work 26% of respondent „Disagree‟ says that they are not encouraged to develop new and More efficient ways to do their work .20% of people‟s „Strongly agree‟ that they are encouraged to develop new and more efficient ways to do their work . 14% of respondent says „Strongly disagree‟ that they are not encouraged to develop new and More efficient ways to do their work. 68
  • 69. CHART-8.19 ABILITY TO DEVLOP NEW AND MAN EFFICIENCY 48 50 45 40 20 35 30 25 20 12 20 15 10 5 0 Strongly disagree disagree Agree Strongly agree 69
  • 70. TABLE-8.20 FLEXIBLITY OF MANAGEMENT IS BALANCING WORK S.NO OPINION NO.OF.RESPONDENTS PERCENTAGE 1 Strongly disagree 18 18 2 disagree 14 14 3 Agree 20 20 4 Strongly agree 48 48 Total 100 100 INFERENCE: From the above table we understand that 48% of the respondents „Strongly agree‟ that management is flexible and understands the importance of balancing both work and personal life.20% of respondents „Agree‟ that management is flexible and understands the importance of balancing both work and personal life.18% of respondents „Strongly disagree‟ that management is not flexible and understands the importance of balancing both work and personal life.14% of respondents „Disagree‟ that management is not flexible and understands the importance of balancing both work and personal life. 70
  • 71. CHART-8.20 FLEXIBLITY OF MANAGEMENT IS BALANCING WORK 48 50 45 40 35 30 20 18 25 14 20 15 10 5 0 Strongly disagree disagree Agree Strongly agree 71
  • 72. FINDINGS  The job enables the employees to develop their skills.  The employees change themselves according to the changing conditions of the organization.  The employees are ready adapt themselves to unexpected obstacles in the organization.  The employees remain persistent even under adversity.  The employees try to solve and manage conflict in a positive and constructive manner.  The company inspires motivation and guides the employees towards the goal of the organization.  The employees works with specific responsibility.  The employees who work hard are reward by the company.  The management is flexible and ready to understand the employees personal life.  The employees are encouraged to develop new and more efficient ways to work 72
  • 73. SUGGESTIONS  The job gives to their employees with full involvement.  Efficient workers are encouraged with promotion and incentives.  We train the adaptation of work should listen the employees.  The management should listen the employee quaries  The employee should be monitored properly 73
  • 74. CONCLUSION Choosing the right type of person to the right type of job enables the employees to do the work with the efficiency and diligently. The organization motivates the employees with the good environment and remuneration. The employees working in the organization is flexible and changes themselves according to the working conditions. The employee‟s conflicts are managed by the organization in a constructive manner. The efficient workers are encouraged with promotion and good remuneration. The objectives of the organization it is clearly defined by the employees. The job given to the employees in such that improves quality of the workers. The employees in a organization should not be given any potential threats by employers. The company should inspire and guide the employees for achievement of goal of the organization. The management guides and direct the employees to vital accomplishment of the enterprise goal . The introduces the subordinates to work with confidence and zeal. The management also stimulates to strive and willing to attend the organizational objectives 74
  • 75.  BIBLOGRAPHY: This information is collected from books, and web resources.  BOOKS: Organisation behavior - Philip kotlar Organisation behaviour - J.Jayasankar Marketing research - P.Ravilochanan  WEB RESOURCES: www.pklindia.com Panther@pklindia.com www.google 75
  • 76. ANNEXURE EMPLOYEE ATTITUDE • This Questionnaire to be filled by the Employees of ____________________ • Please indicate a Tick Mark on the preferred option for each aspect in the Questionnaire NAME : AGE : Designation : Sex : A. Male B. Female 1. This job enables me to develop my skills ? A) Agree B) Dis agree C) Partially agree 2. How long have you worked for this company? A. 0 – 2 Years B. 3 – 4 Years 76
  • 77. C. 5 – 10 years D. More than 10 years 3. No of Dependents in your family? A. 1 B. 2 C. 3 D. Above 3. (Please specify) 4. Do you adapt yourself to the changing conditions, or unexpected obstacles in the organisation? A) Yes B) No 5. I undergo stress when change is preferred? A) Agree B) Dis agree 6. Do you maintain focus and intensity and remain optimistic and persistent, even under adversity? A) Yes B) No 7. Can you determine objectives, set priorities and anticipate potential threats or opportunities? A) Yes B) No 8. Do you think that you can share vision with others; influences others to translate vision into action? 77
  • 78. B) Yes B) No 9. I can you manage and resolves conflicts in a positive and constructive manner to minimize negative impact? A) Strongly disagree B) Disagree C) Agree D) Strongly agree 10. Does your company Inspire, motivate, and guide others toward goal accomplishments? A) Strongly disagree B) Disagree C) Agree D) strongly agree 11. Do you feel that you are a person someone who can be relied upon to carry out your tasks effectively? A) Yes B) No 12. You are a person who can be relied upon to ensure that projects within areas of specific responsibility are completed in a timely manner and within budget.? A) Yes B) No 13. Do you meet the needs of your clients? 78
  • 79. A) Yes B) No 14. Does your company makes effective and timely decisions, even when data is limited or solutions produce unpleasant consequences.? A) Strongly disagree B) Disagree C) Agree D) Strongly agree 15. Can you distinguish between relevant and irrelevant information to make logical decisions. A) Strongly disagree B) Disagree C) Agree D) Strongly agree 16. Did the hard work is usually rewarded by my Company? A) Yes B) No 17. Job promotions within the company are fair and reasonable? A) Strongly disagree B) Disagree C) Agree D) Strongly agree 18. Do you prefer this system of increment on better performance & demotion on improper performance? 79
  • 80. A) Yes B) No 19. I am encouraged to develop new and more efficient ways to do my work? A) Strongly disagree B) Disagree C) Agree D) strongly agree 20. Management is flexible and understands the importance of balancing my work and personal life? A) Strongly disagree B) Disagree C) Agree D) Strongly agree 21. What changes, if any, do you feel need to made in your department to improve working condition ? ________________________________________________________________________ ________________________________________________________________________ ________________________________________________________________________ _______________________________________________________________________ 22. What changes, if any, do you feel need to be made in the company to improve working condition? ________________________________________________________________________ ________________________________________________________________________ ________________________________________________________________________ ________________________________________________________________________ *********************************************************************** THANKS FOR DEVOTING YOUR PRECIOUS TIME FOR FILLING THIS QUESTIONNAIRE 80