
Recommended
More Related Content
What's hot
What's hot (20)
Viewers also liked
Viewers also liked (12)
Similar to Major Project report "MPPT BASED BATTERY CHARGING USING SOLAR ENERGY" (or) solar charge controller
Similar to Major Project report "MPPT BASED BATTERY CHARGING USING SOLAR ENERGY" (or) solar charge controller (20)
Recently uploaded
Recently uploaded (20)
Major Project report "MPPT BASED BATTERY CHARGING USING SOLAR ENERGY" (or) solar charge controller
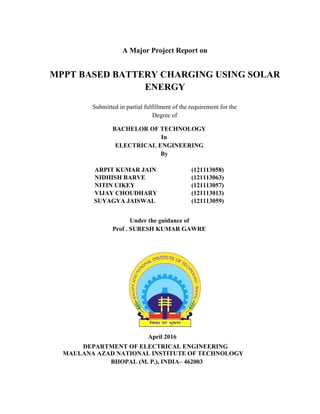
- 1. A Major Project Report on MPPT BASED BATTERY CHARGING USING SOLAR ENERGY Submitted in partial fulfillment of the requirement for the Degree of BACHELOR OF TECHNOLOGY In ELECTRICAL ENGINEERING By ARPIT KUMAR JAIN (121113058) NIDHISH BARVE (121113063) NITIN UIKEY (121113057) VIJAY CHOUDHARY (121113013) SUYAGYA JAISWAL (121113059) Under the guidance of Prof . SURESH KUMAR GAWRE April 2016 DEPARTMENT OF ELECTRICAL ENGINEERING MAULANA AZAD NATIONAL INSTITUTE OF TECHNOLOGY BHOPAL (M. P.), INDIA– 462003
- 2. STUDENT’S DECLARATION We hereby declare that the work presented in the dissertation entitled “MPPT Based Battery Charging Using Solar Energy ” in fulfillment of the requirement for the award of the degree of Bachelor of Technology in Electrical Engineering submitted in the Department of Electrical Engineering, MANIT, Bhopal is an authentic record of our own work under the guidance of Prof Suresh Kumar Gawre. We have submitted the matter embodied in this dissertation for the award of any other degree. Name Scholar No. Sign of students ARPIT KUMAR JAIN (121113058) NIDHISH BARVE (121113063) NITIN UIKEY (121113057) VIJAY CHOUDHARY (121113013) SUYAGYA JAISWAL (121113059) CERTIFICATE This is to certify that the above statements made by us are correct to the best of our knowledge. Supervisor Prof. Suresh Kumar Gawre Department of Electrical Engineering ii
- 3. Table of Contents STUDENT DECLARATION ........................................................................................................ii CERTIFICATE ...............................................................................................................................ii TABLE OF CONTENT................................................................................................................iii LIST OF FIGURES .......................................................................................................................v ABSTRACT...................................................................................................................................vi CHAPTER 1 INTRODUCTION.................................................................................................1 1.1 NEED OF RENEWABLE ENERGY.................................................................................. 2 1.2 DIFFERENT SOURCES OF RENEWABLE ENERGY................................................... 2 1.2.1 WIND ENERGY....................................................................................................... 2 1.2.2 SOLAR ENERGY .................................................................................................... 2 1.2.3 SMALL HYDRO POWER ........................................................................................ 3 1.2.4 GEOTHERMAL........................................................................................................ 3 1.3 LITERATURE REVIEW .................................................................................................... 3 1.4 MOTIVATION.................................................................................................................... 4 1.5 OBJECTIVE...................................................................................................................... 4 CHAPTER 2 MODELLING AND SIMULATION...................................................................5 2.1 PV CELL............................................................................................................................ 6 2.2 PV MODULE ..................................................................................................................... 6 2.3 PV ARRAY......................................................................................................................... 6 2.4 MATLAB SIMULINK MODEL............................................................................................ 6 2.4.1 MODEL OF PV CELL .............................................................................................. 7 2.4.2 MODEL OF MPPT CONTROL................................................................................ 8 2.4.3 MODEL OF CONVERTER ...................................................................................... 8 2.4.4 COMPLETE MODEL ............................................................................................... 9 CHAPTER 3 MAXIMUM POWER POINT TRACKING .....................................................12 3.1 OVERVIEW OF MPPT................................................................................................... 13 3.2 CLASSIFICATION OF MPPT TECHNIQUE.................................................................. 13 3.3 DIFFERENT MPPT TECHNIQUE.................................................................................. 15 3.3.1 PERTURBB AND OBSERVE.............................................................................. 15 3.3.2 INCREMENTAL CONDUCTANCE ..................................................................... 16 3.3.3 S C CURRENT.................................................................................................... 18 3.3.4 O C VOLTAGE .................................................................................................... 18 3.3.3 FUZZY LOGIC CONTROL.................................................................................. 19 3.3.3 NUERAL NETWORK .......................................................................................... 19 3.4 DETAILS OF P AND O TECHNIQUE............................................................................ 20 iii
- 4. CHAPTER 4 BUCK CONVERTER DESIGN ......................................................................21 4.1 BASICS OF CONVERTER ............................................................................................. 22 4.1.1 INTRODUCTION.................................................................................................. 22 4.1.2 BASIC CONFIGURATION OF BUCK CONVERTER.......................................... 22 4.1.3 NECESSARY PARAMETER OF THE POWER STAGES.................................. 24 4.2 SELECTION OF INDUCTOR AND CAPACITOR........................................................... 24 4.2.1 INDUCTOR CALCULATION....................................................................................... 25 4.2.2 CAPACITOR CALCULATION.............................................................................. 26 CHAPTER 5 HARDWARE IMPLEMENTATION OF THE PROJECT.............................27 5.1 COMPONENTS USED IN PROJECT............................................................................. 28 5.1.1 ARDUINO UNO.................................................................................................... 28 5.1.2 CURRENT SENSOR ........................................................................................... 30 5.1.3 VOLTAGE SENSOR............................................................................................ 31 5.1.4 MOSFET .............................................................................................................. 31 5.1.5 BATTERY............................................................................................................. 32 5.1.6 OTHER USEFUL COMPONENTS...................................................................... 32 5.2 TOOLS REQUIRED ........................................................................................................ 33 CHAPTER 6 PROGRAMMING ..............................................................................................34 6.1 MATLAB COMMAND FOR MPPT CONTROL SIMULATION ........................................ 35 6.2 BUCK CONVERTER TEST CODE ................................................................................. 36 6.3ARDUINO UNO PROGRAMMING.................................................................................... 37 CHAPTER 7 CONCLUSION AND FUTURE SCOPE.........................................................51 7.1 CONCLUSION.................................................................................................................. 52 7.2 FUTURE SCOPE ............................................................................................................. 52 REFERENCES ...........................................................................................................................53 APPENDIX..................................................................................................................................54 iv
- 5. LIST OF FIGURES Figure 2.1 Different solar module…………………………………………………………………………..6 Figure 2.2 MATLAB simulink model of PV cell…………………………………………………………...7 Figure 2.3 MATLAB Simulink model of MPPT control …………………………………………………..8 Figure 2.4 Model of buck converter………………………………………………………………………..8 Figure 2.5 Complete Simulink model………………………………………………………………….…..9 Figure 2.6 I-PV curve…………………………………………………………………………………….....9 Figure 2.7 V-PV curve ……………………………………………………………………………………..10 Figure 2.8(a) Voltage – Current curve .…………………………………………………………………..11 Figure 2.8(b) Power – Voltage curve ...……………………………………………………………….....11 Figure 3.1 Different MPPT technique………………………………………………………………….... 14 Figure 3.2 Flow chart of P & O algorithm………………………………………………………………...16 Figure 3.3 Flow chart of INC algorithm…………………………………………………………………...17 Figure 3.4 P V curve………………………………………………………………………………………..20 Figure 4.1 Buck converter power stages…………………………………………………………………23 Figure 4.2 Wave form of source current………………………………………………………………….24 Figure 5.1 Arduino Uno board……………………………………………………………………………..28 Figure 5.2 Current sensor ACS 712………………………………………………………………………30 Figure 5.3 Voltage divider circuit………………………………………………………………………….31 Figure 5.4 MPPT based solar charge controller…………………………………………………………31 Figure. 8.1 prototype of hardware implementation……………………………………………………………54 v
- 6. ABSTRACT The solar energy is converted to electrical energy by photo-voltaic cells. This energy is stored in batteries during day time for utilizing the same during night time. Our aim is to obtain maximum power at the load side from the solar panel. So basic network theorem is applied called maximum power point theorem. Solar energy obtained is in dc form and dc to dc converters are used to use the output of solar voltage to load, it can be either stepped up or stepped down according to requirement. We have used Arduino control board for the duty cycle control of the converter so that required load voltage can be obtained. For this signal from load side is given to the Arduino and Maximum Power Point is obtained using P&O technique. At this MPP, Battery as a load is charged and solar energy is stored in the battery. This stored energy can be used either directly in the dc form or converted to ac with the help of inverter. Various MPPT techniques are utilized for the tracking of MPPT but here we have we have P&O technique. MPPT algorithm is an important process to ensure the best utilization of the PV panels. Maximum power point tracking of solar module aiming to improve conversion efficiency of solar module. Various tracking algorithms are available for this purpose. To implement these techniques required sensing of the panel voltage, panel current, battery voltage, battery current. Sensing the voltage is easy and can be made with very less cost. For current sensing standard Hall-Effect current sensor generally used in the MPPT algorithm. vi
- 8. 2 1.1 NEED OF RENEWABLE ENERGY A developing country requires more energy. Nowadays, most of the energy supplied by fossil fuels such as diesel, coal, petrol, and gas is 80% of our current energy. On top of this energy demand is expected to grow by almost half over the next two decades. Plausibly this is causing some fear that our energy resources are starting to run out, with disturbing consequences for the global economy and global quality of life. Increasing demand of energy results in two main problem climate change and energy crisis. The global energy demand increases, the energy related greenhouse gas production increases. It is a global challenge to reduce the CO2 emission and offer clean, sustainable and affordable energy. The worldwide increasing energy demand Energy saving is one cost effective solution, but does not tackle. Renewable energy is a good option because it gives a clean and green energy, with no CO2 emission. Renewable energy is defined as energy that comes from resources which are naturally refilled on a human timescale such as sunlight, wind, rain, tides, waves and geothermal heat.[10] 1.2 DIFFERENT SOURCES OF RENEWABLE ENERGY 1.2.1 Wind Energy The wind turbine can be used to harness the energy from the airflow. Now a day’s wind energy can be used from 800 kW to 6 MW of rated power. Science power output is the function of the wind speed; it rapidly increases with increase in wind speed. In recent time have led to airfoil wind turbines, which is more efficient due to better aerodynamic structure. 1.2.2 Solar Energy Solar energy is profusely available that has made it possible to harvest it and utilize it properly. Solar energy can be a standalone producing system or can be a grid connected generating unit depending on the availability of a grid nearby. Thus it can be used to produce power in rural areas where the availability of grids is very low. Solar energy is form of energy that directly available from sun and convert in to electrical energy, which is best form of energy without any climatic change and energy crisis. This conversion can be achieved with the help of PV cell or with solar power plants.[1]
- 9. 3 1.2.3 Small Hydro Power Hydropower energy generates power by using a dam or diversion structure to alter the natural flow of a river or other body of water. This energy can be used by conversion the water stored in dam into electrical energy using water turbines. Hydropower, as an energy supply, also provides unique benefits to an electrical system. First, when stored in large quantities in the reservoir behind a dam, it is immediately available for use when required. Second, the energy source can be rapidly adjusted to meet demand instantaneously. 1.2.4 Geothermal Geothermal energy is available in form of thermal energy from heat stored inside the earth. In this steam produced from reservoirs of hot water found a couple of miles or more below the Earth's surface. This energy comes from the decay of radioactive nuclei with long half-lives that are embedded within the Earth, some energy is from residual heat left over from Earths formation and rest of the energy comes from meteorite impacts. 1.3 LITERATURE REVIEW Solar power is one of the renewable energy resource that will hopefully lead us away from coal dependent and petroleum dependent energy resource. The major problem with photovoltaic charging system is that the energy conversion efficiency of solar panel is poor and high cost. Solar panels themselves are quite not efficient in their ability to convert sunlight to energy. The study shows that solar panel convert 35-45% of energy incident on into electrical energy. So our aim is how to decrease the overall cost and energy conversion efficiency of solar panel. To store solar energy charging system is also required to efficiently charge battery with lesser charging time. A Maximum Power Point Tracking algorithm is required to increase the efficiency of the solar panel. The most commonly known are [1] hill-climbing, [2] fractional open circuit voltage control, [3] perturb and observe(P&O), [4] incremental conductance(INC), [5] Neural network control, [6] fuzzy control based etc. These algorithms are varying due to simplicity, effectiveness, merging speed, sensor required and cost. The most commonly algorithm based on current and voltage sensing incremental conductance (INC) and perturb and observe (P&O) is used to track maximum power point (MPP) due to its simplicity, effectiveness & merging speed. Under abruptly change in irradiation level as MPP, changes continuously, P & O receipts
- 10. 4 it as a change in MPP due to perturbation rather than that of irradiation and sometimes ends up in calculating incorrect MPP. However, this problem gets avoided by an incremental conductance method in case of the incremental conductance method algorithm takes two sample of voltage and current to calculate MPP. However, due to higher efficiency, complexity of incremental conductance algorithm. This MPPT algorithm combines with battery charging loop to charge lead acid battery with different charging stage like constant current, constant voltage, float charge. So optimal is charging pattern design to charge Lead acid battery with three different charging stages that are constant current, constant voltage and float charging. This charging pattern of battery efficiently charge battery with lesser charging time.[10] Implementation cost of this pattern very high because both are used voltage and current sensing device. Voltage sensing directly obtain by connecting voltage divider circuit across the panel and directly apply to the microcontroller, but current sensing require current sensor connected between panel and DC-DC converter. Generally, current sensor used for MPP high efficient LEM current sensor. Due to high cost current sensor and other device make up so PV charging system cost effective. Our aim is to design charging pattern so that abstract maximum power from solar module and efficiently charge battery with lesser charging time with low implementation cost.[2] 1.4 MOTIVATION Solar energy is one source of power generation that independent away from petroleum and coal dependent energy resource. The major problem with solar energy is conversion efficiency poorer and high installation cost. Research going into this area to develop the efficient control mechanism and provide better control. So the overall installation cost of photovoltaic charging system reduces. The challenging research work going on in this area is the motivation behind the project. 1.5 OBJECTIVE Our objective is to hardware implement the MPPT technique to obtain maximum output power from solar module. Also to first simulate the same in MATLAB and obtain the desired results.
- 12. 6 2.1 PHOTOVOLTAIC CELL A photovoltaic cell or photoelectric cell is a semiconductor device that converts light to electrical energy by photovoltaic effect. If the energy of photon of light is greater than the band gap then the electron is emitted and the flow of electrons creates current. However a photovoltaic cell is different from a photodiode. In a photodiode light falls on n-channel of the semiconductor junction and gets converted into current or voltage signal but a photovoltaic cell is always forward biased. 2.2 PV MODULE Usually a number of PV modules are arranged in series and parallel to meet the energy requirements. PV modules of different sizes are commercially available. For example, a typical small scale desalination plant requires a few thousand watts of power. 2.3 PV ARRAY A PV array consists of several photovoltaic cells in series and parallel connections. Series connections are responsible for increasing the voltage of the module whereas the parallel connection is responsible for increasing the current in the array. Solar Cells Solar Panel Solar Panel (4 cells ) (Module) (Multiple Module) Figure 2.1 Different solar modules Here in these project Monocrystalline PV Module is used and its electrical specification and characteristic table is as shown below
- 13. 7 Table 2.1 Electrical Characteristic of PV Module Mono crystalline cell: Advantages- 1. It has highest efficiency (15%-20%) 2. Space efficient 3. Its life is long 4. perform better than poly crystalline cell at low light condition.[4] Disadvantages- 1. These cells are expensive 2. If it is partially covered with shade, snow & dirt, the entire circuit may break down. 2.4 MATLAB SIMULINK MODEL 2.4.1 MATLAB Simulink Model of Photovoltaic Cell Figure 2.2 Matlab Simulink Model of Photovoltaic Cell Maximum Power – Pmax 40 W Voltage at Pmax – Vmax 16.4 V Current at Pmax – Imax 0.61 A Short - circuit current – Isc 0.71 A Open – voltage circuit – voc 17.2 V Total number of cells in series (Ns) 36 Total number of array in parallel (Np) 4
- 14. 8 2.4.2 MATLAB Simulink Model of MPPT Control of PWM Generation Figure 2.3 Matlab Simulink Model of MPPT control and PWM generation 2.4.3 MATLAB Simulink Model of Buck Converter and PWM Pulse Figure 2.4 Matlab Simulink Model of Buck converter and PWM pulse.
- 15. 9 2.4.4 Complete MATLAB Simulink Model Figure. 2.5 Complete Matlab Simulink Model 2.5 MATLAB Simulink Result Figure 2.6 I_PV CURVE
- 16. 10 Figure 2.7 V_PV AND OUTPUT VOLTAGE CURVE
- 17. 11 Figure 2.8(a) VOLTAGE – CURRENT CURVE Figure 2.8(b) POWER – VOLTAGE CURVE
- 18. 12 CHAPTER 3 MAXIMUM POWER POINT TRACKING
- 19. 13 3.1 AN OVERVIEW OF MAXIMUM POWER POINT TRACKING A typical solar panel converts only 30 to 40 percent of the incident solar irradiation into electrical energy. Maximum power point tracking technique is used to improve the efficiency of the solar panel. According to Maximum Power Transfer theorem, the power output of a circuit is maximum when the Thevenin impedance of the circuit (source impedance) matches with the load impedance. Hence our problem of tracking the maximum power point reduces to an impedance matching problem. In the source side we are using a buck convertor connected to a solar panel in order to enhance the output voltage so that it can be used for different applications like motor load. By changing the duty cycle of the buck converter appropriately we can match the source impedance with that of the load impedance.[5] 3.2 CLASSIFICATION OF MPPT TECHNIQUE There are different ways of classifying MPPT techniques, some based on the number of variables used to track MPP like one variable or two variable methods, and some based on the type of techniques used to track MPP. The different MPPT control techniques are classified into broadly three groups: Offline (indirect), Online (direct) and other techniques, mainly on the basis of parameters required to track MPP. Offline control techniques usually use technical data of PV panels to estimate the MPP. These data includes prior information like, I–V and P–V curves of the panels for different climatic conditions, different mathematical models etc. of PV panels. Online (direct) methods on the other hand use real time, PV voltages and/or current measurements for tracking MPP. These methods do not require the measurement of temperature and solar irradiance and also the PV array model. The offline methods are cost effective but performance wise less effective than online and other methods. Other methods include either modification or combination of these methods or methods based on indirect calculations.[10]
- 20. 14 Figure.3.1 Different types MPPT techniques.
- 21. 15 3.3 DIFFERENT MPPT TECHNIQUE There are different techniques used to track the maximum power point. Few of the most popular techniques are: 1. Perturb and observe (hill climbing method) 2. Incremental Conductance method 3. Fractional short circuit current 4. Fractional open circuit voltage 5. Neural networks 6. Fuzzy logic 3.3.1 Perturb & Observe Perturb & Observe (P&O) is the simplest method. In this we use only one sensor, that is the voltage sensor, to sense the PV array voltage and so the cost of implementation is less and hence easy to implement. The time complexity of this algorithm is very less but on reaching very close to the MPP it doesn’t stop at the MPP and keeps on perturbing on both the directions. When this happens the algorithm has reached very close to the MPP and we can set an appropriate error limit or can use a wait function which ends up increasing the time complexity of the algorithm. However the method does not take account of the rapid change of irradiation level (due to which MPPT changes) and considers it as a change in MPP due to perturbation and ends up calculating the wrong MPP. Perturb and observe (P&O) is one of the famous algorithm due to its simplicity used for maximum power point tracking. This algorithm based on voltage and current sensing based used to track MPP. In this controller require calculation for power and voltage to track MPP. In this voltage is perturbed in one direction and if power is continuous to increase then algorithm keep on perturb in same direction. If new power is less than previous power then perturbed in opposite direction. When module power reach at MPP there is oscillation around MPP point.[3]
- 22. 16 Figure 3.2 Flow chart of Perturb and observe algorithm 3.3.2 Incremental Conductance Incremental conductance method uses two voltage and current sensors to sense the output voltage and current of the PV array. The left hand side is the instantaneous conductance of the solar panel. When this instantaneous conductance equals the conductance of the solar then MPP is reached. Here we are sensing both the voltage and current simultaneously. Hence the error due to change in irradiance is eliminated. However the complexity and the cost of implementation increases. As we go down the list of algorithms the complexity and the cost of implementation goes on increasing which may be suitable for a highly complicated system. This is the reason that Perturb and Observe and Incremental Conductance method are the most widely used algorithms.[3]
- 23. 17 In this technique, the controller measures incremental change in module voltage and current to observe the effect of a power change [1] . This method requires more calculation but can track fast than perturb and observe algorithm (P&O). Under abruptly change in irradiation level as maximum power point changes continuously, P&O receipts it as a change in MPP due to perturb rather than that of isolation and sometimes ends up in calculating incorrect MPP. However this problem get avoided by incremental conductance (INC).In this method algorithm takes two sample of voltage and current to maximize power from solar module. However due to effectiveness and complexity of incremental conductance algorithm very high compare to perturb and observe. Like the P&O algorithm, it can produce oscillations in power output. This study on realizing MPPT by improved incremental conductance method with variable step-size [6]. So these are two advantage of incremental conductance method. So in our implementation to achieve high efficiency this method utilize incremental conductance (dI/dV) of the photovoltaic array to calculate the sign of the change in power with respect to voltage (dP/dV). The controller maintains this voltage till the isolation changes and the process is repeated. Figure 3.3 Flow chart of incremental conductance algorithm
- 24. 18 3.3.3 Fractional short circuit current MPPT Fractional ISC results from the fact that, under varying atmospheric conditions, IMPP is approximately linearly related to the ISC of the PV array. IMPP =k2 Isc Where k2 is a proportionality constant. Just like in the fractional VOC technique, k2 has to be determined according to the PV array in use. The constant K2 is generally found to be between 0.78 and 0.92. Measuring ISC during operation is problematic. An additional switch usually has to be added to the power converter to periodically short the PV array so that ISC can be measured using a current sensor. 3.3.4 Fractional open circuit voltage MPPT The near linear relationship between VMPP and VOC of the PV array, under varying irradiance and temperature levels, has given rise to the fractional VOC method. VMPP = k1 Voc where k1 is a constant of proportionality. Since k1 is dependent on the characteristics of the PV array being used, it usually has to be computed beforehand by empirically determining VMPP and VOC for the specific PV array at different irradiance and temperature levels. The factor k1 has been reported to be between 0.71 and 0.78. Once k1 is known, VMPP can be computed with VOC measured periodically by momentarily shutting down the power converter.However; this incurs some disadvantages, including temporary loss of power.Fractional open circuit (FOCV) fast and simple way of MPPT tracking. This algorithm not able to track exact maximum power point. Reason is that when irradiation level and temperature of module changes correspondingly MPP point change but this algorithm work on fixed value of voltage at MPP. This algorithm work on principle that voltage at MPP is nearly equal to open circuit voltage of module by factor N. Value of N basically braying from .68 to .80 that depend on type of module used.[4]
- 25. 19 3.3.5 Fuzzy Logic Control Microcontrollers have made using fuzzy logic control popular for MPPT over last decade. Fuzzy logic controllers have the advantages of working with imprecise inputs, not needing an accurate mathematical model, and handling nonlinearity. 3.3.6 Neural Network Another technique of implementing MPPT which are also well adapted for microcontrollers is neural networks. Neural networks commonly have three layers: input, hidden, and output layers. The number nodes in each layer vary and are user dependent. The input variables can be PV array parameters like VOC and ISC, atmospheric data like irradiance and temperature, or any combination of these. The output is usually one or several reference signals like a duty cycle signal used to drive the power converter to operate at or close to the MPPT [4]. TABLE 3.1 COMPARISONS OF DIFFERENT MPPT TECHNIQUES
- 26. 20 3.4 DETAIL OF P &O TECNIQUE The Perturb & Observe algorithm states that when the operating voltage of the PV panel is perturbed by a small increment, if the resulting change in power P is positive, then we are going in the direction of MPP and we keep on perturbing in the same direction. If P is negative, we are going away from the direction of MPP and the sign of perturbation supplied has to be changed [5]. Figure 3.4 Solar panel Characteristic showing MPP and Operating point A & B
- 27. 21 CHAPTER 4 BUCK CONVERTER DESIGN
- 28. 22 4.1 BASICS OF CONVERTER 4.1.1 Introduction There are three basic types of dc-dc converter circuits, termed as buck, boost and buck-boost. In all of these circuits, a power device is used as a switch. This device earlier used was a thyristor, which is turned on by a pulse fed at its gate. In all these circuits, the thyristor is connected in series with load to a dc supply, or a positive (forward) voltage is applied between anode and cathode terminals. The thyristor turns off, when the current decreases below the holding current, or a reverse (negative) voltage is applied between anode and cathode terminals. So, a thyristor is to be force-commutated, for which additional circuit is to be used, where another thyristor is often used. Later, GTO’s came into the market, which can also be turned off by a negative current fed at its gate, unlike thyristors, requiring proper control circuit. The turn-on and turn-off times of GTOs are lower than those of thyristors. So, the frequency used in GTO-based choppers can be increased, thus reducing the size of filters. Earlier, dc-dc converters were called ‘choppers’, where thyristors or GTOs are used. It may be noted here that buck converter (dc-dc) is called as ‘step-down chopper’, whereas boost converter (dc-dc) is a ‘step-up chopper’. In the case of chopper, no buck-boost type was used. These converters are now being used for applications, one of the most important being Switched Mode Power Supply (SMPS). Similarly, when application requires high voltage, Insulated Gate Bi-polar Transistors (IGBT) are preferred over BJTs, as the turn-on and turn-off times of IGBTs are lower than those of power transistors (BJT), thus the frequency can be increased in the converters using them. So, mostly self-commutated devices of transistor family as described are being increasingly used in dc-dc converter.[6] 4.1.2 Basic Configuration of Buck Converter A buck converter (dc-dc) is shown in Fig.3.1. Only a switch is shown, for which a device as described earlier belonging to transistor family is used. Also a diode (termed as freewheeling) is used to allow the load current to flow through it, when the switch (i.e., a device) is turned off. The load is inductive (R- L) one. In some cases, a battery (or back emf) is connected in series with the load (inductive). Due to the load inductance, the load current must be allowed a path,
- 29. 23 which is provided by the diode; otherwise, i.e., in the absence of the above diode, the high induced emf of the inductance, as the load current tends to decrease, may cause damage to the switching device. If the switching device used is a thyristor, this circuit is called as a step-down chopper, as the output voltage is normally lower than the input voltage. Similarly, this dc-dc converter is termed as buck one, due to reason given later.is provided by the diode; otherwise, i.e., in the absence of the above diode, the high induced emf of the inductance, as the load current tends to decrease, may cause damage to the switching device. If the switching device used is a thyristor, this circuit is called as a step-down chopper, as the output voltage is normally lower than the input voltage. Similarly, this dc-dc converter is termed as buck one, due to reason given later. The basic operation of the buck converter has the current in an inductor controlled by two switches (usually a transistor and a diode). In the idealized converter, all the components are considered to be perfect. Specifically, the switch and the diode have zero voltage drop when on and zero current flow when off and the inductor has zero series resistance. Further, it is assumed that the input and output voltages do not change over the course of a cycle (this would imply the output capacitance as being infinite).[4] Fig. 4.1 Buck Converter (dc-dc) Power Stage
- 30. 24 Fig.4.2 Waveforms of source current 4.1.3 Necessary Parameters of the Power Stage The following four parameters are needed to calculate the power stage: 1. Input voltage range: VIN(min) and VIN(max) 2. Nominal output voltage: VOUT 3. Maximum output current: IOUT(max) 4. Integrated circuit used to build the buck converter. This is necessary because some parameters for the calculations must be derived from the data sheet. If these parameters are known, the power stage can be calculated. 4.2 Selection of Inductor and Capacitor First calculate Maximum duty cycle ………………… (1) Where, VIN(max) = maximum input voltage VOUT = output voltage η = efficiency of the converter, e.g., estimated 90%
- 31. 25 4.2.1 Inductor calculation Data sheets often give a range of recommended inductor values. If this is the case, choose an inductor from this range. The higher the inductor value, the higher is the maximum output current because of the reduced ripple current. In general, the lower the inductor value, the smaller is the solution size. Note that the inductor must always have a higher current rating than the maximum current, this is because the current increases with decreasing inductance. [7] For parts where no inductor range is given, the following equation is a good estimation for the right inductor: ……………………….(2) Assume: We are designing for a 40 W solar panel and 12 V battery Input voltage (Vin) =16.4 V Output Voltage (Vout)=12 V Output current (Iout) =40W/12V =3.33 A (approx) Switching Frequency (Fsw)=50 KHz Duty Cycle (D) =Vout/Vin= 12/16.4 =0.71 or 71% Calculation L= ( Vin-Vout ) x D x 1/Fsw x 1/ dI ……………………………….(3) Where dI is Ripple current For a good design typical value of ripple current is in between 30 to 40 % of load current. Let dI =35% of rated current dI=35% of 3.33=0.35 x 3.33 =1.17A So L= (16.4.0-12.0) x 0.71 x (1/50k) x (1/1.17) = 57.65uH =58uH (approx)
- 32. 26 Inductor peak current =Iout+dI/2 = 2.4+(1.17/2) = 3A 4.2.2 Output Capacitor Calculation ...………………………... (4) The out put capacitor ( Cout)= dI / (8 x fs x dV) ……………………………(5) Where dV is ripple voltage Let voltage ripple( dV ) = 20mV Cout= 1.17/ (8 x 50000 x 0.02 ) = 183.75 uF By taking some margin, select 220uF electrolytic capacitor.
- 34. 28 5.1 COMPONENTS USED IN PROJECT 5.1.1 ARDUINO UNO Arduino Uno is a microcontroller board based on the ATmega328P. It has 14 digital input/output pins (of which 6 can be used as PWM outputs), 6 analog inputs, a 16 MHz quartz crystal, a USB connection, a power jack, an ICSP header and a reset button. It contains everything needed to support the microcontroller; simply connect it to a computer with a USB cable or power it with a AC -to-DC adapter or battery to get started. You can tinker with your UNO without worrying too much about doing something wrong, worst case scenario you can replace the chip for a few Rupees and start over again [8]. Figure 5.1 Arduino Uno board
- 35. 29 Table 5.1 Technical specification of Arduino Uno board Microcontroller ATmega328P Operating Voltage 5 V Input Voltage (recommended) 7-12 V Input Voltage (limit) 6-20 V Digital I/O Pins 14 (of which 6 provide PWM output) PWM Digital I/O Pins 6 Analog Input Pins 6 DC Current per I/O Pin 20 Ma DC Current for 3.3V Pin 50 Ma Flash Memory 32KB(ATmega328P) of which 0.5 KB used by bootloader SRAM 2 KB (ATmega328P) EEPROM 1 KB (ATmega328P) Clock Speed 16 MHz Length 68.6 mm
- 36. 30 5.1.2 Current Sensor For current measurement we have used a Hall Effect current sensor ACS 712(5A). The ACS712 (5A) sensor read the current value and converts it into a relevant voltage value; the value that links the two measurements is sensitivity [9]. As per data sheet for ACS 712 (5A) models: 1. Sensitivity is 185mV/A. 2. The sensor can measure positive and negative currents (range -5A…5A), 3. Power supply is 5V 4. Middle sensing voltage is 2.5V when no current Figure 5.2 Current Sensor ACS 712 Table 5.2 Rating of Current Sensor ACS 712
- 37. 31 5.1.3 Voltage Sensor Arduino’s analog inputs can be used to measure DC voltage between 0 and 5V (when using the standard 5V analog reference voltage) and this range can be increased by using two resistors to create a voltage divider. The voltage divider decreases the voltage being measured to within the range of the Arduino analog inputs. We can use this to measure the solar panel and battery voltages.[6] Figure 5.3 Voltage Divider Circuit 5.1.4 MOSFET The vital component of a buck converter is MOSFET.Choosing a right MOSFET from the variety of it available in the market is quite challenging task. These are few basic parameters for selecting right MOSFET. 1. Voltage Rating: Vds of MOSFET should be greater than 20% or more than the rated voltage. 2. Current Rating: Ids of MOSFET should be greater than 20% or more than the rated current. 3. ON Resistance (Rds on) : Select a MOSFET with low ON Resistance (Ron) 4. Conduction Loss: It depends on Rds(ON) and duty cycle. Keep the conduction loss minimum. 5. Switching Loss: Switching loss occurs during the transition phase. It depends on switching frequency, voltage, current etc. Try to keep it minimum.[2]
- 38. 32 Table 5.3 Rating of Mosfet IRFZ44N Also we have provided mosfet heat sink 5.1.5 Battery -lead acid battery -nominal voltage :12 V -capacity : 1.3 Ah 5.1.6 Other useful components 1. Capacitor 2. Inductor 3. Diodes 4. Resistor 5. Wires and Jump wires 6. Fuses 7. Heat sink 8. LCD display 9. LED 10. Screw terminals
- 39. 33 5.2 TOOLS REQUIRED : 1. Soldering Iron 2. Glue Gum 3. Cordless Drill 4. Knife 5. Wire Cutter 6. Wire Stripper 7. Screw Driver 8. Ruler and pencil 5.3 SCHEMATIC DIAGRAM OF MPPT BASED SOLAR CHARGE CONTROLLER Figure 5.4 MPPT based solar charge controller
- 41. 35 6.1 MATLAB COMMAND FOR MPPT CONTROL SIMULATION: function D = PandO(Param, Enabled, V, I) % MPPT controller based on the Perturb & Observe algorithm. % D output = Duty cycle of the boost converter (value between 0 and 1) % Enabled input = 1 to enable the MPPT controller % V input = PV array terminal voltage (V) % I input = PV array current (A) % % Param input: Dinit = Param(1); %Initial value for D output Dmax = Param(2); %Maximum value for D Dmin = Param(3); %Minimum value for D deltaD = Param(4);%Increment value used to increase/decrease the duty cycle D % ( increasing D = decreasing Vref ) % persistent Vold Pold Dold; dataType = 'double'; if isempty(Vold) Vold=0; Pold=0; Dold=Dinit; end P= V*I; dV= V - Vold; dP= P - Pold; if dP ~= 0 & Enabled ~=0 if dP < 0 if dV < 0 D = Dold + deltaD; else D = Dold - deltaD; end else if dV < 0 D = Dold - deltaD; else D = Dold + deltaD; end end else D=Dold; end if D >= Dmax | D<= Dmin D=Dold;
- 42. 36 end Dold=D; Vold=V; Pold=P; 6.2 BUCK CONVERTER TEST CODE: #include <TimerOne.h> void setup() { // Initialize the digital pin as an output. // Pin 13 has an LED connected on most Arduino boards pinMode(13, OUTPUT); pinMode(9, OUTPUT); pinMode(8, OUTPUT); digitalWrite(8, HIGH); Timer1.initialize(20); // set a timer of length 8uS //Timer1.attachInterrupt( timerIsr ); // attach the service routine here //Set duty cycle // Timer1.pwm (9,256); // 25% duty cycle // Timer1.pwm (9, 512); // 50% duty cycle Timer1.pwm (9, 768); // 75% duty cycle } void loop() { // Main code loop // TODO: Put your regular (non-ISR) logic here } // Custom ISR Timer Routine void timerIsr() { // Toggle LED //digitalWrite( 13, digitalRead( 13 ) ^ 1 ); }
- 43. 37 6.3 ARDUINO MPPT SOLAR CHARGE CONTROLLER (ARDUINO UNO PROGRAMMING): // This code is for an arduino Uno based Solar MPPT charge controller. // Specifications : // 1.Solar panel power = 40W // 2.Rated Battery Voltage= 12V ( lead acid type ) // 3.Maximum current = 5A // 4.Maximum load current =10A // 5. In put Voltage = Solar panel with Open circuit voltage from 16 to 20V //////////////////////////////////////////////////////////////// #include "TimerOne.h" // using Timer1 library from http://www.arduino.cc/playground/Code/Timer1 #include <LiquidCrystal_I2C.h> // using the LCD I2C Library from https://bitbucket.org/fmalpartida/new-liquidcrystal/downloads #include <Wire.h> //-------------------------------------------------------------- //////// Arduino pins Connections//////// // A0 - Voltage divider (solar) // A1 - ACS 712 Out // A2 - Voltage divider (battery) // A4 - LCD SDA // A5 - LCD SCL // D2 - ESP8266 Tx // D3 - ESP8266 Rx through the voltage divider // D5 - LCD back control button // D6 - Load Control // D8 - 2104 MOSFET driver SD // D9 - 2104 MOSFET driver IN // D11- Green LED // D12- Yellow LED // D13- Red LED ///////// Definitions ///////// #define SOL_VOLTS_CHAN 0 // defining the adc channel to read solar volts #define SOL_AMPS_CHAN 1 // Defining the adc channel to read solar amps #define BAT_VOLTS_CHAN 2 // defining the adc channel to read battery volts #define AVG_NUM 8 // number of iterations of the adc routine to average the adc readings // ACS 712 Current Sensor is used. Current Measured = (5/(1024 *0.185))*ADC - (2.5/0.185) #define SOL_AMPS_SCALE 0.026393581 // the scaling value for raw adc reading to get solar amps // 5/(1024*0.185) #define SOL_VOLTS_SCALE 0.029296875 // the scaling value for raw adc reading to get solar volts // (5/1024) *(R1+R2)/R2 // R1=100k and
- 44. 38 R2=20k #define BAT_VOLTS_SCALE 0.029296875 // the scaling value for raw adc reading to get battery volts #define PWM_PIN 9 // the output pin for the pwm (only pin 9 avaliable for timer 1 at 50kHz) #define PWM_ENABLE_PIN 8 // pin used to control shutoff function of the IR2104 MOSFET driver (When high, the mosfet driver is on) #define PWM_FULL 1023 // the actual value used by the Timer1 routines for 100% pwm duty cycle #define PWM_MAX 100 // the value for pwm duty cyle 0- 100% #define PWM_MIN 60 // the value for pwm duty cyle 0- 100% (below this value the current running in the system is = 0) #define PWM_START 90 // the value for pwm duty cyle 0- 100% #define PWM_INC 1 //the value the increment to the pwm value for the ppt algorithm #define FALSE 0 #define ON TRUE #define OFF FALSE #define TURN_ON_MOSFETS digitalWrite(PWM_ENABLE_PIN, HIGH) // enable MOSFET driver #define TURN_OFF_MOSFETS digitalWrite(PWM_ENABLE_PIN, LOW) // disable MOSFET driver #define ONE_SECOND 50000 //count for number of interrupt in 1 second on interrupt period of 20us #define LOW_SOL_WATTS 5.00 //value of solar watts // this is 5.00 watts #define MIN_SOL_WATTS 1.00 //value of solar watts // this is 1.00 watts #define MIN_BAT_VOLTS 11.00 //value of battery voltage // this is 11.00 volts #define MAX_BAT_VOLTS 14.10 //value of battery voltage// this is 14.10 volts #define BATT_FLOAT 13.60 // battery voltage we want to stop charging at #define HIGH_BAT_VOLTS 13.00 //value of battery voltage // this is 13.00 volts #define LVD 11.5 //Low voltage disconnect setting for a 12V system #define OFF_NUM 9 // number of iterations of off charger state //--------------------------------------------------------------------- //Defining led pins for indication #define LED_RED 11
- 45. 39 #define LED_GREEN 12 #define LED_YELLOW 13 //--------------------------------------------------------------------- // Defining load control pin #define LOAD_PIN 6 // pin-6 is used to control the load //--------------------------------------------------------------------- // Defining lcd back light pin #define BACK_LIGHT_PIN 5 // pin-5 is used to control the lcd back light //--------------------------------------------------------------------- ////////////////////////////BIT MAP ARRAY/////////////////////// //--------------------------------------------------------------------- byte solar[8] = //icon for solar panel { 0b11111, 0b10101, 0b11111, 0b10101, 0b11111, 0b10101, 0b11111, 0b00000 }; byte battery[8]= // icon for battery { 0b01110, 0b11011, 0b10001, 0b10001, 0b11111, 0b11111, 0b11111, 0b11111, }; byte _PWM [8]= // icon for PWM { 0b11101, 0b10101, 0b10101, 0b10101, 0b10101, 0b10101, 0b10101, 0b10111, }; //--------------------------------------------------------------
- 46. 40 // global variables float sol_amps; // solar amps float sol_volts; // solar volts float bat_volts; // battery volts float sol_watts; // solar watts float old_sol_watts = 0; // solar watts from previous time through ppt routine unsigned int seconds = 0; // seconds from timer routine unsigned int prev_seconds = 0; // seconds value from previous pass unsigned int interrupt_counter = 0; // counter for 20us interrrupt unsigned long time = 0; // variable to store time the back light control button was pressed in millis int delta = PWM_INC; // variable used to modify pwm duty cycle for the ppt algorithm int pwm = 0; // pwm duty cycle 0-100% int back_light_pin_State = 0; // variable for storing the state of the backlight button int load_status = 0; // variable for storing the load output state (for writing to LCD) enum charger_mode {off, on, bulk, bat_float} charger_state; // enumerated variable that holds state for charger state machine // set the LCD address to 0x27 for a 20 chars 4 line display // Set the pins on the I2C chip used for LCD connections: // addr, en,rw,rs,d4,d5,d6,d7,bl,blpol LiquidCrystal_I2C lcd(0x27, 2, 1, 0, 4, 5, 6, 7, 3, POSITIVE); // Set the LCD I2C address //--------------------------------------------------------------------- // This routine is automatically called at powerup/reset //--------------------------------------------------------------------- void setup() // run once, when the sketch starts { pinMode(LED_RED, OUTPUT); // sets the digital pin as output pinMode(LED_GREEN, OUTPUT); // sets the digital pin as output pinMode(LED_YELLOW, OUTPUT); // sets the digital pin as output pinMode(PWM_ENABLE_PIN, OUTPUT); // sets the digital pin as output Timer1.initialize(20); // initialize timer1, and set a 20uS period Timer1.pwm(PWM_PIN, 0); // setup pwm on pin 9, 0% duty cycle TURN_ON_MOSFETS; // turn off MOSFET driver chip Timer1.attachInterrupt(callback); // attaches callback() as a timer overflow interrupt Serial.begin(9600); // open the serial port at 9600 bps: pwm = PWM_START; // starting value for pwm charger_state = on; // start with charger state as off pinMode(BACK_LIGHT_PIN, INPUT); // backlight on button
- 47. 41 pinMode(LOAD_PIN,OUTPUT); // output for the LOAD MOSFET (LOW = on, HIGH = off) digitalWrite(LOAD_PIN,HIGH); // default load state is OFF lcd.begin(20,4); // initialize the lcd for 16 chars 2 lines, turn on backlight lcd.noBacklight(); // turn off the backlight lcd.createChar(1,solar); // turn the bitmap into a character lcd.createChar(2,battery); // turn the bitmap into a character lcd.createChar(3,_PWM); // turn the bitmap into a character } //--------------------------------------------------------------------- // Main loop //--------------------------------------------------------------------- void loop() { read_data(); // read data from inputs run_charger(); // run the charger state machine print_data(); // print data load_control(); // control the connected load led_output(); // led indication lcd_display(); // lcd display } //--------------------------------------------------------------------- // This routine reads and averages the analog inputs for this system, solar volts, solar amps and // battery volts. //--------------------------------------------------------------------- int read_adc(int channel) { int sum = 0; int temp; int i; for (i=0; i<AVG_NUM; i++) { // loop through reading raw adc values AVG_NUM number of times temp = analogRead(channel); // read the input pin sum += temp; // store sum for averaging delayMicroseconds(50); // pauses for 50 microseconds } return(sum / AVG_NUM); // divide sum by AVG_NUM to get average and return it } //--------------------------------------------------------------------- // This routine reads all the analog input values for the system. Then it multiplies them by the scale // factor to get actual value in volts or amps. //---------------------------------------------------------------------
- 48. 42 void read_data(void) { sol_amps = (read_adc(SOL_AMPS_CHAN) * SOL_AMPS_SCALE -12.01); //input of solar amps sol_volts = read_adc(SOL_VOLTS_CHAN) * SOL_VOLTS_SCALE; //input of solar volts bat_volts = read_adc(BAT_VOLTS_CHAN) * BAT_VOLTS_SCALE; //input of battery volts sol_watts = sol_amps * sol_volts ; //calculations of solar watts } //--------------------------------------------------------------------- // This is interrupt service routine for Timer1 that occurs every 20uS. //--------------------------------------------------------------------- void callback() { if (interrupt_counter++ > ONE_SECOND) { // increment interrupt_counter until one second has passed interrupt_counter = 0; // reset the counter seconds++; // then increment seconds counter } } //--------------------------------------------------------------------- // This routine uses the Timer1.pwm function to set the pwm duty cycle. //--------------------------------------------------------------------- void set_pwm_duty (void) { if (pwm > PWM_MAX) { // check limits of PWM duty cyle and set to PWM_MAX pwm = PWM_MAX; } else if (pwm < PWM_MIN) { // if pwm is less than PWM_MIN then set it to PWM_MIN pwm = PWM_MIN; } if (pwm < PWM_MAX) { Timer1.pwm(PWM_PIN,(PWM_FULL * (long)pwm / 100), 20); // use Timer1 routine to set pwm duty cycle at 20uS period //Timer1.pwm(PWM_PIN,(PWM_FULL * (long)pwm / 100)); } else if (pwm == PWM_MAX) { // if pwm set to 100% it will be on full but we have Timer1.pwm(PWM_PIN,(PWM_FULL - 1), 20); // keep switching so set duty cycle at 99.9% //Timer1.pwm(PWM_PIN,(PWM_FULL - 1)); } } //--------------------------------------------------------------------- // This routine is the charger state machine. It has four states on,
- 49. 43 off, bulk and float. // It's called once each time through the main loop to see what state the charger should be in. // The battery charger can be in one of the following four states: // On State - this is charger state for MIN_SOL_WATTS < solar watts < LOW_SOL_WATTS. In this state isthe solar // watts input is too low for the bulk charging state but not low enough to go into the off state. // In this state we just set the pwm = 99.9% to get the most of low amount of power available. // Bulk State - this is charger state for solar watts > MIN_SOL_WATTS. This is where we do the bulk of the battery // charging and where we run the Peak Power Tracking alogorithm. In this state we try and run the maximum amount // of current that the solar panels are generating into the battery. // Float State - As the battery charges it's voltage rises. When it gets to the MAX_BAT_VOLTS we are done with the // bulk battery charging and enter the battery float state. In this state we try and keep the battery voltage // at MAX_BAT_VOLTS by adjusting the pwm value. If we get to pwm = 100% it means we can't keep the battery // voltage at MAX_BAT_VOLTS which probably means the battery is being drawn down by some load so we need to back // into the bulk charging mode. // Off State - This is state that the charger enters when solar watts < MIN_SOL_WATTS. The charger goes into this // state when there is no more power being generated by the solar panels. The MOSFETs are turned // off in this state so that power from the battery doesn't leak back into the solar panel. //--------------------------------------------------------------------- void run_charger(void) { static int off_count = OFF_NUM; switch (charger_state) { case on: if (sol_watts < MIN_SOL_WATTS) { // if watts input from the solar panel is less than charger_state = off; // the minimum solar watts then off_count = OFF_NUM; // go to the charger off state TURN_OFF_MOSFETS; } else if (bat_volts > (BATT_FLOAT - 0.1)) { // else if the battery voltage has gotten above the float charger_state = bat_float; // battery float voltage go to the charger battery float state } else if (sol_watts < LOW_SOL_WATTS) { // else if
- 50. 44 the solar input watts is less than low solar watts pwm = PWM_MAX; // it means there is not much power being generated by the solar panel set_pwm_duty(); // so we just set the pwm = 100% so we can get as much of this power as possible } // and stay in the charger on state else { pwm = ((bat_volts * 10) / (sol_volts / 10)) + 5; // else if we are making more power than low solar watts figure out what the pwm charger_state = bulk; // value should be and change the charger to bulk state } break; case bulk: if (sol_watts < MIN_SOL_WATTS) { // if watts input from the solar panel is less than charger_state = off; // the minimum solar watts then it is getting dark so off_count = OFF_NUM; // go to the charger off state TURN_OFF_MOSFETS; } else if (bat_volts > BATT_FLOAT) { // else if the battery voltage has gotten above the float charger_state = bat_float; // battery float voltage go to the charger battery float state } else if (sol_watts < LOW_SOL_WATTS) { // else if the solar input watts is less than low solar watts charger_state = on; // it means there is not much power being generated by the solar panel TURN_ON_MOSFETS; // so go to charger on state } else { // this is where we do the Peak Power Tracking ro Maximum Power Point algorithm if (old_sol_watts >= sol_watts) { // if previous watts are greater change the value of delta = -delta; // delta to make pwm increase or decrease to maximize watts } pwm += delta; // add delta to change PWM duty cycle for PPT algorythm (compound addition) old_sol_watts = sol_watts; // load old_watts with current watts value for next time set_pwm_duty(); // set pwm duty cycle to pwm value } break; case bat_float:
- 51. 45 if (sol_watts < MIN_SOL_WATTS) { // if watts input from the solar panel is less than charger_state = off; // the minimum solar watts then it is getting dark so off_count = OFF_NUM; // go to the charger off state TURN_OFF_MOSFETS; set_pwm_duty(); } else if (bat_volts > BATT_FLOAT) { // If we've charged the battery abovethe float voltage TURN_OFF_MOSFETS; // turn off MOSFETs instead of modiflying duty cycle pwm = PWM_MAX; // the charger is less efficient at 99% duty cycle set_pwm_duty(); // write the PWM } else if (bat_volts < BATT_FLOAT) { // else if the battery voltage is less than the float voltage - 0.1 pwm = PWM_MAX; set_pwm_duty(); // start charging again TURN_ON_MOSFETS; if (bat_volts < (BATT_FLOAT - 0.1)) { // if the voltage drops because of added load, charger_state = bulk; // switch back into bulk state to keep the voltage up } } break; case off: // when we jump into the charger off state, off_count is set with OFF_NUM TURN_OFF_MOSFETS; if (off_count > 0) { // this means that we run through the off state OFF_NUM of times with out doing off_count--; // anything, this is to allow the battery voltage to settle down to see if the } // battery has been disconnected else if ((bat_volts > BATT_FLOAT) && (sol_volts > bat_volts)) { charger_state = bat_float; // if battery voltage is still high and solar volts are high } else if ((bat_volts > MIN_BAT_VOLTS) && (bat_volts < BATT_FLOAT) && (sol_volts > bat_volts)) { charger_state = bulk; } break; default: TURN_OFF_MOSFETS;
- 52. 46 break; } } //-------------------------------------------------------------- //////////////////////////LOAD CONTROL////////////////////////// //-------------------------------------------------------------- void load_control(){ if ((sol_watts < MIN_SOL_WATTS) && (bat_volts > LVD)){ // If the panel isn't producing, it's probably night digitalWrite(LOAD_PIN, LOW); // turn the load on load_status = 1; // record that the load is on } else{ // If the panel is producing, it's day time digitalWrite(LOAD_PIN, HIGH); // turn the load off load_status = 0; // record that the load is off } } //-------------------------------------------------------------- // This routine prints all the data out to the serial port. //-------------------------------------------------------------- void print_data(void) { Serial.print(seconds,DEC); Serial.print(" "); Serial.print("Charging = "); if (charger_state == on) Serial.print("on "); else if (charger_state == off) Serial.print("off "); else if (charger_state == bulk) Serial.print("bulk "); else if (charger_state == bat_float) Serial.print("float"); Serial.print(" "); Serial.print("pwm = "); Serial.print(pwm,DEC); Serial.print(" "); Serial.print("Current (panel) = "); Serial.print(sol_amps); Serial.print(" "); Serial.print("Voltage (panel) = "); Serial.print(sol_volts); Serial.print(" ");
- 53. 47 Serial.print("Power (panel) = "); Serial.print(sol_volts); Serial.print(" "); Serial.print("Battery Voltage = "); Serial.print(bat_volts); Serial.print(" "); Serial.print("nr"); //delay(1000); } //-------------------------------------------------------------- //------------------------Led Indication------------------------ //-------------------------------------------------------------- void led_output(void) { if(bat_volts > 14.1 ) { leds_off_all(); digitalWrite(LED_YELLOW, HIGH); } else if(bat_volts > 11.9 && bat_volts < 14.1) { leds_off_all(); digitalWrite(LED_GREEN, HIGH); } else if(bat_volts < 11.8) { leds_off_all; digitalWrite(LED_RED, HIGH); } } //-------------------------------------------------------------- // This function is used to turn all the leds off //-------------------------------------------------------------- void leds_off_all(void) { digitalWrite(LED_GREEN, LOW); digitalWrite(LED_RED, LOW); digitalWrite(LED_YELLOW, LOW); } //-------------------------------------------------------------- //-------------------------- LCD DISPLAY ----------------------- //-------------------------------------------------------------- void lcd_display() { back_light_pin_State = digitalRead(BACK_LIGHT_PIN);
- 54. 48 if (back_light_pin_State == HIGH) { time = millis(); // If any of the buttons are pressed, save the time in millis to "time" } lcd.setCursor(0, 0); lcd.print("SOL"); lcd.setCursor(4, 0); lcd.write(1); lcd.setCursor(0, 1); lcd.print(sol_volts); lcd.print("V"); lcd.setCursor(0, 2); lcd.print(sol_amps); lcd.print("A"); lcd.setCursor(0, 3); lcd.print(sol_watts); lcd.print("W "); lcd.setCursor(8, 0); lcd.print("BAT"); lcd.setCursor(12, 0); lcd.write(2); lcd.setCursor(8, 1); lcd.print(bat_volts); lcd.setCursor(8,2); if (charger_state == on) { lcd.print(" "); lcd.setCursor(8,2); lcd.print("on"); } else if (charger_state == off) { lcd.print(" "); lcd.setCursor(8,2); lcd.print("off"); } else if (charger_state == bulk) { lcd.print(" "); lcd.setCursor(8,2); lcd.print("bulk"); } else if (charger_state == bat_float) { lcd.print(" "); lcd.setCursor(8,2); lcd.print("float"); }
- 55. 49 //----------------------------------------------------------- //--------------------Battery State Of Charge --------------- //----------------------------------------------------------- lcd.setCursor(8,3); if ( bat_volts >= 12.7) lcd.print( "100%"); else if (bat_volts >= 12.5 && bat_volts < 12.7) lcd.print( "90%"); else if (bat_volts >= 12.42 && bat_volts < 12.5) lcd.print( "80%"); else if (bat_volts >= 12.32 && bat_volts < 12.42) lcd.print( "70%"); else if (bat_volts >= 12.2 && bat_volts < 12.32) lcd.print( "60%"); else if (bat_volts >= 12.06 && bat_volts < 12.2) lcd.print( "50%"); else if (bat_volts >= 11.90 && bat_volts < 12.06) lcd.print( "40%"); else if (bat_volts >= 11.75 && bat_volts < 11.90) lcd.print( "30%"); else if (bat_volts >= 11.58 && bat_volts < 11.75) lcd.print( "20%"); else if (bat_volts >= 11.31 && bat_volts < 11.58) lcd.print( "10%"); else if (bat_volts < 11.3) lcd.print( "0%"); //-------------------------------------------------------------- //-------------------------Duty Cycle--------------------------- //-------------------------------------------------------------- lcd.setCursor(15,0); lcd.print("PWM"); lcd.setCursor(19,0); lcd.write(3); lcd.setCursor(15,1); lcd.print(" "); lcd.setCursor(15,1); lcd.print(pwm); lcd.print("%"); //------------------------------------------------------------- //------------------------Load Status-------------------------- //------------------------------------------------------------- lcd.setCursor(15,2); lcd.print("Load"); lcd.setCursor(15,3); if (load_status == 1) { lcd.print(" "); lcd.setCursor(15,3); lcd.print("On"); } else
- 56. 50 { lcd.print(" "); lcd.setCursor(15,3); lcd.print("Off"); } backLight_timer(); // call the backlight timer function in every loop } void backLight_timer(){ if((millis() - time) <= 15000) // if it's been less than the 15 secs, turn the backlight on lcd.backlight(); // finish with backlight on else lcd.noBacklight(); // if it's been more than 15 secs, turn the backlight off }
- 57. 51 CHAPTER 7 CONCLUSIONS AND FUTURE SCOPE
- 58. 52 CONCLUSIONS: This method presented here control lead acid battery charging faster and efficiently. The control algorithm execute P&O method allow module to operate at maximum power point according to solar irradiation, and match load with the source impedance to provide maximum power. This MPPT model is more suitable because of less cost, easier circuit design. And efficiency of the circuit is increased by 20-25% in case of MPPT solar charge controller compare to a circuit without MPPT. And also saved the extra energy required in mechanical tracking. As Arduino based controlling is used, it maintained constant 12V at the output terminal i.e. at the battery terminal. FUTURE SCOPE: 1) Hybrid of MPPT with mechanical tracking will give more efficiency, project can be extended in this direction. 2) Battery output is directly utilized to feed power in the dc grid which can be used for charging electronic devices like laptop, mobile directly. 3) By adding wifi module we can record our data in the system and optimize the data for better use. 4) Solar panel installed on urban and sub-urban areas with modified technology will lead in saving of our bill.
- 59. 53 REFERENCES: [1]. G.C Hsieh, C.Y. Tsai, and H.I. Hsieh, “Photovoltaic Power‐Increment Aided Incremental‐ Conductance Maximum Power Point Tracking Controls,” in Proc. IEEE PEDG, pp. 542-549, Aalborg, Denmark, 2012. [2]. G.C. Hsieh, S.W. Chen, and C .Y. Tsai, “Interleaved Smart Burp PV Charger for Lead Acid Batteries with Incremental Conductance MPPT,” in Proc. IEEE ECCE, Phoenix, pp. 3248- 3255, 2011. [3]. Azadeh Safari and Saad Mekhilef, “Simulation and Hardware Implementation of Incremental Conductance MPPT With Direct Control Method Using Cuk Converter”, IEEE Trans. Ind. Electron, vol. 58, no. 4, pp. 1154 – 1161, April 2011. [4]. M. Gradella, J. Rafael, E. Ruppert,” Comprehensive approach to Modeling and simulation of photovoltaic arrays”, IEEE Trans. Power Electron. vol. 24, no. 5, May 2009. [5]. B. Liu, S. Duan, F. Liu, and P. Xu, “Analysis and improvement of maximum power point tracking algorithm based on incremental conductance method for photovoltaic array,” inProc. IEEE PEDS, 2007, pp. 637–641. [6]. Z. Yan, L. Fei, Y. Jinjun, and D. Shanxu, “Study on realizing MPPT by improved incremental conductance method with variable step-size,” inProc. IEEE ICIEA, Jun. 2008, pp. 547–550. [7]. W. Xiao,M. G. J. Lind,W. G. Dunford, and A. Capel, “Real-time identification of optimal operating points in photovoltaic power systems,” IEEE Trans. Ind. Electron., vol. 53, no. 4, pp. 1017–1026, Jun. 2006. [8]. S. Minami, Y. Onishi, S. J. Hou, and A. Kozawa, “A New Intense Pulse charging Method for the Prolongation of Life in Lead-acid Batteries” Journal Asian Electric Vehicles, Vol. 2, No. 1, pp. 541-544, 2004. [9]. D.P Hohm, M. E. Ropp, “Comparative Study of Maximum Power Point Tracking Algorithms Using an Experimental, Programmable, Maximum Power Point Tracking Test Bed”, Photovoltaic Specialists Conference, 2000. Conference Record of the Twenty-Eighth IEEE,pp 1699 – 1702, 15-22 Sept. 2000. [10] Pallavee Bhatnagar, R.K. Nema,” Maximum power point tracking control technique: State of art in photovoltaic application.”
- 60. 54 APPENDIX: FIG. 8.1 Prototype of Hardware Implementation
- 61. 55
- 62. 56