TRA infographic on Australian tourism 2014
•
5 gostaram•3,746 visualizações

Tourism Research Australia infographic on Australian tourism 2014

Recomendados
Mais conteúdo relacionado
Destaque
Destaque (10)
Semelhante a TRA infographic on Australian tourism 2014
Semelhante a TRA infographic on Australian tourism 2014 (20)
Último
Último (16)
TRA infographic on Australian tourism 2014
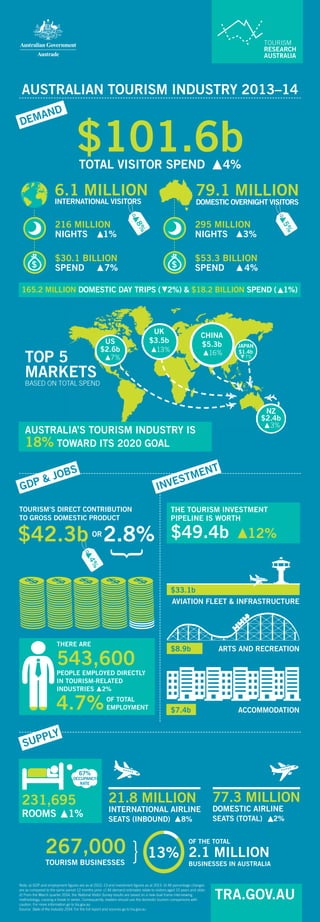
- 1. AUSTRALIAN TOURISM INDUSTRY 2013–14 TOP 5 MARKETS BASED ON TOTAL SPEND 4% ▶ ▶ ▶ ▶ ▶ ▶ 165.2 MILLION DOMESTIC DAY TRIPS ( 2%) & $18.2 BILLION SPEND ( 1%) $3.5b 13% $2.6b 13% $2.4b 3% CHINA $5.3b 16% UK $3.5b 13% NZ $2.4b 3% JAPAN $1.4b 7% US 7% ▶ ▶ ▶ ▶ ▶ 4% TOURISM’S DIRECT CONTRIBUTION TO GROSS DOMESTIC PRODUCT THE TOURISM INVESTMENT PIPELINE IS WORTH THERE ARE 543,600 PEOPLE EMPLOYED DIRECTLY IN TOURISM-RELATED INDUSTRIES 2% 4.7% OF TOTAL EMPLOYMENT OR $42.3b } $49.4b 12% AVIATION FLEET & INFRASTRUCTURE ARTS AND RECREATION ACCOMMODATION GDP & JOBS SUPPLY INVESTMENT $33.1b $8.9b $7.4b OF THE TOTAL 2.1 MILLION BUSINESSES IN AUSTRALIA 13% } 267,000 TOURISM BUSINESSES 231,695 ROOMS 1% 21.8 MILLION INTERNATIONAL AIRLINE SEATS (INBOUND) 8% 77.3 MILLION DOMESTIC AIRLINE SEATS (TOTAL) 2% 67% OCCUPANCY RATE ▶ ▶ TRA.GOV.AU Note: a) GDP and employment figures are as at 2012–13 and investment figures as at 2013. b) All percentage changes are as compared to the same period 12 months prior. c) All demand estimates relate to visitors aged 15 years and older. d) From the March quarter 2014, the National Visitor Survey results are based on a new dual frame interviewing methodology, causing a break in series. Consequently, readers should use the domestic tourism comparisons with caution. For more information go to tra.gov.au Source: State of the Industry 2014. For the full report and sources go to tra.gov.au DEMAND 216 MILLION NIGHTS 1% $30.1 BILLION SPEND 7% 295 MILLION NIGHTS 3% $53.3 BILLION SPEND 4% 6.1 MILLION INTERNATIONAL VISITORS 79.1 MILLION DOMESTIC OVERNIGHT VISITORS ▶ ▶ ▶ ▶ $ $ 8% 5% ▶ ▶ $101.6b TOTAL VISITOR SPEND 4% ▶ AUSTRALIA’S TOURISM INDUSTRY IS 18% TOWARD ITS 2020 GOAL 2.8%