SlideShare a Scribd company logo
1 of 115
Download to read offline
POWER SYSTEM ANALYSIS
UNIT I THE POWER SYSTEM – AN OVERVIEW AND MODELLING
Structure of electric power system – Current scenario – Complex power – Concepts of real
and
reactive power – Per phase analysis – Modeling of generator, transformer with off-nominal
tap
ratio, transmission line – Per unit system – One-line, Impedance and reactance diagrams –
Change
of base – Primitive network and network matrices – Y-bus formulation by direct inspection
and
singular transformation methods.
UNIT II POWER FLOW ANALYSIS
System model – The power flow equations (PFE) – System variables – PFE in real form –
Basic
problems, modified specification – Bus classification – Solution technique – Gauss-seidel
method
– Newton-raphson method – Fast-decoupled method – Comparison of solution techniques.
UNIT III SYMMETRICAL FAULT ANALYSIS
Internal voltages of loaded machines under fault conditions – Balanced three phase fault –
Fault
calculations using bus impedance matrix – Algorithm for formation of the impedance matrix
–
Selection of circuit breakers.
UNIT IV SYMMETRICAL COMPONENTS AND UNBALANCED FAULT
ANALYSIS
Symmetrical component analysis of unsymmetrical faults – LG – LL – LLG faults – Open
conductor faults – Unbalanced fault analysis using bus impedance matrix.
UNIT V POWER SYSTEM STABILITY
Rotor dynamics and swing equation – Stability classification – Small signal stability – Large
signal
stability – Equal area criterion and solution of SMIB system problems – Solution of swing
equation – Point-by-point method, R-K method and modified euler method – Techniques for
stability improvement.
L: 45 T: 15 Total: 60
TEXT BOOKS
1. Grainger, J.J. and William D. Stevenson Jr., “Power System Analysis”, Tata McGraw Hill,
2005.
2. Gupta, B.R., “Power System Analysis and Design” S.Chand and Co., Ltd, 2005.
REFERENCES
1. Gupta, J.B., “A Course in Electrical Power”, S.K.Kataria and Sons, 2002.
UNIT I
THE POWER SYSTEM – AN OVERVIEW AND MODELLING
Structure of electric power system – Current scenario – Complex power –
Concepts of real and
reactive power – Per phase analysis – Modeling of generator, transformer with
off-nominal tap
ratio, transmission line – Per unit system – One-line, Impedance and reactance
diagrams – Change
of base – Primitive network and network matrices – Y-bus formulation by direct
inspection and
singular transformation methods.
Power system
A Power system consists of Generation, Transmission and Distribution.
Power system analysis
The evaluation of power system is called as power system analysis
Functions of power system analysis
To monitor the voltage at various buses, real and reactive power flow
between buses.
To design the circuit breakers.
To plan future expansion of the existing system
To analyze the system under different fault conditions
To study the ability of the system for small and large disturbances
(Stability studies)
Components of power system
The components of power system are Generators, Power transformers,
Transmission lines, Distribution lines, Loads and compensating devices like shunt,
series, and static VAR compensator.
Modern power system
A modern power system can be subdivided into four major parts: Generation,
Transmission and Sub transmission, Distribution and Loads.
Per phase analysis.
A balanced three phase system is always analyses on per phase basis by
considering one of the three phase lines and neutral.
Infinite bus bar
A large system whose voltage and frequency remain constant, independent of
the power exchange between synchronous machine and bus, and independent of the
excitation of the synchronous machine.
Single line diagram
A single line diagram is diagrammatic representation of power system in
which the components are represented by their symbols and interconnection between
them are shown by a straight line9eventhough the system is three phase system0.The
ratings and the impedances of the components are also marked on the single line
diagram.
Purpose of using single line diagram
The purpose of the single line diagram is to supply in concise form of the
significant information about the system.
Impedance diagram & approximations made in impedance diagram
The impedance diagram is the equivalent circuit of power system in which the
various components of power system are represented by their approximate or
simplified equivalent circuits. The impedance diagram is used for load flow studies.
Approximation:
(i) The neutral reactances are neglected.
(ii) The shunt branches in equivalent circuit of transformers are neglected.
Reactance diagram & approximations made in reactance diagram?
The reactance diagram is the simplified equivalent circuit of power system in
which the various components of power system are represented by their reactances.
The reactance diagram can be obtained from impedance diagram if all the resistive
components are neglected. The reactance diagram is used for fault calculations.
Approximation:
(i) The neutral reactances are neglected.
(ii) The shunt branches in equivalent circuit of transformers are neglected.
(iii) The resistances are neglected.
(iv) All static loads are neglected.
(v) The capacitance of transmission lines are neglected.
Per unit value.
The per unit value of any quantity is defined as the ratio of the actual value of
the any quantity to the base value of the same quantity as a decimal.
Advantages of per unit system
i. Per unit data representation yields valuable relative magnitude information.
ii. Circuit analysis of systems containing transformers of various transformation
ratios is greatly simplified.
iii. The p.u systems are ideal for the computerized analysis and simulation of
complex power system problems.
iv. Manufacturers usually specify the impedance values of equivalent in per unit
of the equipments rating. If the any data is not available, it is easier to assume
its per unit value than its numerical value.
v. The ohmic values of impedances are refereed to secondary is different from
the value as referee to primary. However, if base values are selected properly,
the p.u impedance is the same on the two sides of the transformer.
vi. The circuit laws are valid in p.u systems, and the power and voltages
equations are simplified since the factors of √3 and 3 are eliminated.
vii.
Need for base values
The components or various sections of power system may operate at different
voltage and power levels. It will be convenient for analysis of power system if the
voltage, power, current and impedance rating of components of power system are
expressed with reference to a common value called base value.
Equation for per unit impedance if change of base occurs.
A generator rated at 30MVA, 11KV has a reactance of 20%.Calculate its per unit
reactance for a base of 50 MVA and 10KV.
MVA new = 50 ; KV new = 10 ; MVA old = 30 ; KV old = 11
X p.u = 20% = 20/100 = 0.2 p.u
New p.u impedance if the new base MVA is twice the old base MVA
Draw the per unit reactance diagram for the power systems shown below. Neglect
resistance and use a base of 100MVA, 220KV in 50 ohms line. The ratings of the
generator, motor and transformers are
G: 40MVA, 25KV, X’’ = 20%
M: 50MVA, 11KV, X’’ = 30%
T1: 40MVA, 33 Y/ 220Y KV, X = 15%
T2: 30MVA, 11 Δ / 220Y KV, X = 15%
Load: 11KV, 50MW+j68 MVAR
Solution:
Base MVA, MVAb, new = 100MVA
Base KV, KVb, new = 220KV
j 50Ω
G1 M
T1 T2
Reactance of the transmission line:
Actual reactance =50Ω
Reactance of the Transformer T1:
;
; =?
= 33 KV
Reactance of the Generator G:
;
; = 33
Reactance of the Transformer T2:
;
; =?
= 11 KV
Reactance of the Motor M:
;
; = 11
Reactance Diagram
1. Draw the reactance diagram using a base of 50MVA and 13.8KV on generatorG1
j 0.287
j 0.375 j 0.1033 j 0.5
j 0.6
Eg
Em
G1 G3
G2
T1 T3
T2
Line 1 Line 2
j80Ω j100Ω
G1: 20MVA, 13.8KV, X’’=20% ; G2: 30MVA, 18.0KV, X’’=20%
G3: 30MVA, 20.0KV, X’’=20% ; T1: 25MVA, 220/13.8 KV, X =10%
T2:3Single phase unit each rated 10MVA, 127/18 KV, X =10%
T3: 35MVA, 220/22 KV, X =10%
Solution:
Base MVA, MVAb, new = 50MVA
Base KV, KVb, new = 13.8KV
Reactance of the Generator G1:
;
; = 13.8
Reactance of the Transformer T1 :( Primary side)
;
; = 13.8
Reactance of the transmission line j 80Ω:
Actual reactance =80Ω
= 220 KV
Reactance of the transmission line j 100Ω:
Actual reactance =100Ω
= 220 KV
Reactance of the Transformer T2:( Primary side)
Connection; voltage rating: 220/18KV
;
; =220?
Reactance of the Generator G2:
;
; = ?
= 18KV
Reactance of the Transformer T3 :( Secondary side)
;
; = 220
Reactance of the Generator G3:
;
; = ?
= 22KV
Reactance Diagram
j 0.5
j 0.2 j 0.0826 j 0.1033 j 0.1667
j 0.333j 0.1429
A simple power system is shown in fig. Redraw this system where the per unit impedance
of the components are represented on a common 5000 VA base and common system base
voltage of 250V.
Solution:
Base MVA, MVAb, new = 5000 VA = 5MVA
Base KV, KVb, new = 250V = 0.25KV
Impedance of the Generator G1:
;
; = 0.25
Impedance of the Generator G2:
Z=40 + j 150Ω
G1
T1 T2
G2
Load
1000VA
250V
Z = j0.2 p.u
2000VA
250V
Z = j0.3 p.u
4000VA
250/800V
Z = j0.2 p.u
8000VA
1000/500V
Z = j0.06 p.u
2500VA
400V
;
; = 0.25
Impedance of the Transformer T1: (Primary side)
;
; = 0.25
Impedance of the transmission line Z= 40+ j 100Ω:
Actual impedance = (40+j150) Ω
= 800 V
Impedance of the Transformer T2: (Primary side)
;
; = 0.8
Impedance of the Load
Reactance Diagram
2. The single line diagram of a three phase power system is shown in fig. Select a
common base of 100MVA and 13.8KV on the generator side. Draw per unit
impedance diagram
G: 90MVA, 13.8KV, X=18% ; T1 :50MVA, 13.8/220KV, X=10%
T2:50MVA, 220/11KV, X=10% ; T3 :50MVA, 13.8/132KV, X=10%
T4:50MVA, 132/11KV, X=10% ; M : 80MVA, 10.45KV, X=20%
LOAD : 57MVA, 0.8 p.f lagging at 10.45 KV ; Line 1 = j 50Ω ; Line 2 = j 70Ω
Solution:
Base MVA, MVAb, new = 100MVA
Base KV, KVb, new = 13.8KV
Reactance of the Generator G1:
;
; = 13.8
Reactance of the Transformer T1 :( Primary side)
j 0.75
j 0.25 0.3125 + j 1.17 j 0.0585 j0.5
j 1.0
Load
j 50Ω
T1 T2
2
j70Ω
G M
T3 T4
4
;
; = 13.8
Reactance of the transmission line j 50Ω:
Actual reactance =50Ω
= 220 KV
Reactance of the Transformer T2 :( Primary side)
;
; = 220
Reactance of the Transformer T3 :( Primary side)
;
; = 13.8
Reactance of the transmission line j 70Ω:
Actual reactance =70Ω
= 132KV
Reactance of the Transformer T4 :( Primary side)
;
; = 132
Reactance of the Motor M:
;
; = ?
= 11KV
The load is at 0.8 p.f lagging is given by
Load impedance is given by
Base impedance for the load is
Reactance Diagram
Part-A
1. What is Power system?
2. What is power system analysis?
3. What are the functions of power system analysis?
4. What are the components of power system?
5. What is modern power system?
6. Define per phase analysis.
7. Draw the per phase model or equivalent circuit model or representation
all components of power system? -
8. What is an infinite bus bar?.
9. What is single line diagram?
10. What is the purpose of using single line diagram?
11. What is impedance diagram? What are the approximations made in
impedance diagram?
12. What is reactance diagram? What are the approximations made in
reactance diagram?
Part-B
1. Explain the modeling of generator, load, transmission line and transformer for power
flow, short circuit and stability studies.
3. Draw the per unit reactance diagram for the power systems shown below. Neglect
resistance and use a base of 100MVA, 220KV in 50 ohms line. The ratings of the
generator, motor and transformers are Draw the reactance diagram using a base of
50MVA and 13.8KV on generatorG1
G1 G3
G2
T1 T3
T2
Line 1 Line 2
j80Ω j100Ω
G1: 20MVA, 13.8KV, X’’=20% ; G2: 30MVA, 18.0KV, X’’=20%
G3: 30MVA, 20.0KV, X’’=20% ; T1: 25MVA, 220/13.8 KV, X =10%
T2:3Single phase unit each rated 10MVA, 127/18 KV, X =10%
T3: 35MVA, 220/22 KV, X =10%
4. A simple power system is shown in fig. Redraw this system where the per unit
impedance of the components are represented on a common 5000 VA base and
common system base voltage of 250V.
1. The single line diagram of a three phase power system is shown in fig. Select a
common base of 100MVA and 13.8KV on the generator side. Draw per unit
impedance diagram
G: 90MVA, 13.8KV, X=18% ; T1 :50MVA, 13.8/220KV, X=10%
T2:50MVA, 220/11KV, X=10% ; T3 :50MVA, 13.8/132KV, X=10%
T4:50MVA, 132/11KV, X=10% ; M : 80MVA, 10.45KV, X=20%
Z=40 + j 150Ω
G1
T1 T2
G2
Load
1000VA
250V
Z = j0.2 p.u
2000VA
250V
Z = j0.3 p.u
4000VA
250/800V
Z = j0.2 p.u
8000VA
1000/500V
Z = j0.06 p.u
2500VA
400V
j 50Ω
T1 T2
2
j70Ω
G M
T3 T4
4
LOAD : 57MVA, 0.8 p.f lagging at 10.45 KV ; Line 1 = j 50Ω ; Line 2 = j 70Ω
UNIT-II
POWER FLOW ANALYSIS
System model – The power flow equations (PFE) – System variables – PFE in real form –
Basic
problems, modified specification – Bus classification – Solution technique – Gauss-seidel
method
– Newton-raphson method – Fast-decoupled method – Comparison of solution techniques.
Bus
The meeting point of various components in a power system is called a bus.
The bus is a conductor made of copper or aluminium having negligible resistance .At
some of the buses power is being injected into the network, whereas at other buses it
is being tapped by the system loads.
Bus admittance matrix
The matrix consisting of the self and mutual admittance of the network of the
power system is called bus admittance matrix (Ybus).
Methods available for forming bus admittance matrix
Direct inspection method.
Singular transformation method.(Primitive network)
Power flow study or load flow study
The study of various methods of solution to power system network is referred
to as load flow study. The solution provides the voltages at various buses, power
flowing in various lines and line losses.
Information’s that are obtained from a load flow study
The information obtained from a load flow study is magnitude and phase angle
of voltages, real and reactive power flowing in each line and the line losses. The load
flow solution also gives the initial conditions of the system when the transient
behavior of the system is to be studied.
Need for load flow study
The load flow study of a power system is essential to decide the best operation
of existing system and for planning the future expansion of the system. It is also
essential foe designing a new power system.
Quantities associated with each bus in a system
Each bus in a power system is associated with four quantities and they are real
power (P), reactive power (Q), magnitude of voltage (V), and phase angle of
voltage (δ).
Different types of buses in a power system, buses are classified and its types
Types of bus Known or
specified
quantities
Unknown quantities or
quantities to be
determined.
Slack or Swing or Reference
bus
V, δ P,Q
Generator or Voltage control or
PV bus
P, V Q, δ
Load or PQ bus P, Q V, δ
Need for slack bus
The slack bus is needed to account for transmission line losses. In a power
system the total power generated will be equal to sum of power consumed by loads
and losses. In a power system only the generated power and load power are specified
for buses. The slack bus is assumed to generate the power required for losses. Since
the losses are unknown the real and reactive power are not specified for slack bus.
Iterative methods to solve load flow problems
The load flow equations are non linear algebraic equations and so explicit
solution as not possible. The solution of non linear equations can be obtained only by
iterative numerical techniques.
Mainly used for solution of load flow study
The Gauss seidal method, Newton Raphson method and Fast decouple
methods.
Flat voltage start
In iterative method of load flow solution, the initial voltages of all buses
except slack bus assumed as 1+j0 p.u. This is refereed to as flat voltage start
Effect of acceleration factor in load flow study
Acceleration factor is used in gauss seidal method of load flow solution to
increase the rate of convergence. Best value of A.F=1.6
Generator buses are treated as load bus
If the reactive power constraints of a generator bus violates the specified limits
then the generator is treated as load bus.
Advantages and disadvantages of Gauss serial method
Advantages: Calculations are simple and so the programming task is lessees.
The memory requirement is less. Useful for small systems; Disadvantages:
Requires large no. of iterations to reach converge .Not suitable for large systems.
Convergence time increases with size of the system
Advantages and disadvantages of N.R method
Advantages: Faster, more reliable and results are accurate, require less
number of iterations; Disadvantages: Program is more complex, memory is more
complex.
Compare the Gauss seidel and Newton raphson methods of load flow study
S.No G.S N.R FDLF
1 Require large number of
iterations to reach
convergence.
Require less number
of iterations to reach
convergence.
Require more number of
iterations than N.R method.
2 Computation time per
iteration is less
Computation time per
iteration is more
Computation time per iteration
is less
3 It has linear convergence
characteristics
It has quadratic
convergence
characteristics
------
4 The number of iterations
required for convergence
increases with size of the
system
The number of
iterations are
independent of the
size of the system
The number of iterations are
does not dependent of the size
of the system
5 Less memory
requirements.
More memory
requirements.
Less memory requirements
than N.R.method.
Y matrix of the sample power system as shown in fig. Data for this system is given in
table.
Find out the Y matrix of the sample power system network diagram as shown in fig.
Consider the system shown in fig. It shows a transmission network with impedance of
transmission lines all in p.u as shown. Compute Ybus matrix.
0.02+j0.04
0.0125+j0.0250.01+j0.03
1 2
3
y12 = 10 - j 20
y13 = 10 - j 30
y32 = 16 - j 32
Ybus =
Gauss seidel load flow problem.
The following is the system data for a load flow solution. Determine the voltages at
the end of first iteration using Gauss-Seidel method. Take α=1.6 .
The line admittances:
Bus code Admittance
1-2 2-j8.0
1-3 1-j4.0
2-3 0.666-j2.664
2-4 1-j4.0
3-4 2-j8.0
The schedule of active and reactive powers:
Bus code P in p.u Q in p.u V in p.u Remarks
1 - - 1.06 Slack
2 0.5 0.2 1+j0.0 PQ
3 0.4 0.3 1+j0.0 PQ
4 0.3 0.1 1+j0.0 PQ
Solution
=
=
= 1.01187-j0.02888
V2
1
acc = (1.0+j0.0)+1.6(1.01187-j0.02888-1.0-j0.0) = 1.01899-j0.046208
V3
1
= 0.994119-j0.029248 ; V3
1
acc = 0.99059-j0.0467968
V4
1
= 0.9716032-j0.064684 ; V4
1
acc = 0.954565-j0.1034944
Fig shows that the one line diagram of a simple three bus system with generation at
bus 1.The magnitude of voltage at a bus 1 is adjusted to 1.05 p.u. The scheduled loads
at buses2 and 3 are as marked on the diagram. Line impedances are marked in n p.u
on a 100MVA base and the line charging susceptances are neglected.
a. Using the Gauss-Seidel method, determine the phasor values of the
voltages at the load buses 2 and 3(P-Q buses) accurate to decimal places.
b. Find the slack bus real and reactive power.
c. Determine the line flows and line losses. Construct a power flow diagram
showing the direction of line flow.
1 0.02+j0.04 2
0.01+j0.03 0.0125+j0.025
Slack bus
V1=1.05/_0º
138.6 45.2
MW MVAR
3
256.6MW
110.2MVAR
Newton raphson seidel load flow problem.
Fast decoupled load flow problem.
Part-A
1. What is a bus?
2. What is bus admittance matrix?
3. What are the methods available for forming bus admittance matrix?
4. What is power flow study or load flow study?
.
5. What are the informations that are obtained from a load flow study?
6. What is the need for load flow study?
.
7. What are the quantities associated with each bus in a system?
8. What are the different types of buses in a power system? Or how the buses are
classified and what are its types?
9. What is the need for slack bus?
10. Why do we go for iterative methods to solve load flow problems?
11. What are the methods mainly used for solution of load flow study?
12. What do you mean by a flat voltage start?
13. Discuss the effect of acceleration factor in load flow study.
14. When the generator buses are treated as load bus.
Part-B
1. Find out the Y matrix of the sample power system as shown in fig. Data for this
system is given in table.
1. 2. Find out the Y matrix of the sample power system network diagram as shown in
fig.
3. Consider the system shown in fig. It shows a transmission network with impedance
of transmission lines all in p.u as shown. Compute Ybus matrix.
0.02+j0.04
0.0125+j0.0250.01+j0.03
1 2
3
UNIT-III
SYMMETRICAL FAULT ANALYSIS
Internal voltages of loaded machines under fault conditions – Balanced three phase fault –
Fault
calculations using bus impedance matrix – Algorithm for formation of the impedance matrix
–
Selection of circuit breakers.
Fault
A fault in a circuit is any failure which interferes with the normal flow of
current. The faults are associated with abnormal change in current, voltage and
frequency of the power system.
Faults occur in a power system
The faults occur in a power system due to
Insulation failure of equipment
Flashover of lines initiated by a lighting stroke
Due to permanent damage to conductors and towers or due to
accidental faulty operations.
various types of faults
(i) Series fault or open circuit fault
One open conductor fault
Two open conductor fault
(ii) Shunt fault or short circuit fault.
Symmetrical fault or balanced fault
 Three phase fault
Unsymmetrical fault or unbalanced fault
 Line to ground (L-G) fault
 Line to Line (L-L) fault
 Double line to ground (L-L-G) fault
Relative frequency of occurrence of various types of fault
Types of fault Relative frequency of
occurrence of faults
Three phase fault 5%
Double line to ground fault 10%
Line to Line fault 15%
Line to ground fault 70%
.
Symmetrical fault or balanced three phase fault
This type of fault is defined as the simultaneous short circuit across all the
three phases. It occurs infrequently, but it is the most severe type of fault encountered.
Because the network is balanced, it is solved by per phase basis using Thevenins
theorem or bus impedance matrix or KVL, KCL laws.
Need for short circuit studies or fault analysis
Short circuit studies are essential in order to design or develop the protective
schemes for various parts of the system .To estimate the magnitude of fault current for
the proper choice of circuit breaker and protective relays.
Bolted fault or solid fault
A Fault represents a structural network change equivalent with that caused by
the addition of impedance at the place of a fault. If the fault impedance is zero, the
fault is referred as bolted fault or solid fault.
Reason for transients during short circuits
The faults or short circuits are associated with sudden change in currents.
Most of the components of the power system have inductive property which opposes
any sudden change in currents, so the faults are associated with transients.
Doubling effect
If a symmetrical fault occurs when the voltage wave is going through zero
then the maximum momentary short circuit current will be double the value of
maximum symmetrical short circuit current. This effect is called doubling effect.
DC off set current
The unidirectional transient component of short circuit current is called DC off
set current.
Synchronous reactance or steady state condition reactance
The synchronous reactance is the ratio of induced emf and the steady state rms
current. It is the sum of leakage reactance (Xl) and the armature reactance (Xa).
Sub transient reactance
Fault
The synchronous reactance is the ratio of induced emf on no load and the sub
transient symmetrical rms current.
Transient reactance
The synchronous reactance is the ratio of induced emf on no load and the transient
symmetrical rms current.
short circuit capacity of power system or fault level.
Short circuit capacity (SCC) or Short circuit MVA or fault level at a bus is defined
as the product of the magnitude of the prefault bus voltage and the post fault current.
SCC or Short circuit MVA =
Or
SCC =
fault current in fig., if the prefault voltage at the fault point is 0.97 p.u.
Fault
Fault
j0.15j0.15
j0.2 F
j0.2 and j 0.15 are in series. j0.2+ j 0.15 = j 0.35
J0.35 is in parallel with j 0.15
=
Bus impedance matrix
Bus impedance matrix is the inverse of the bus admittance matrix.
The matrix consisting of driving point impedance and transfer impedances of
the network is called as bus impedance matrix. Bus impedance matrix is symmetrical.
Methods available for forming bus impedance matrix
Form bus admittance matrix and take the inverse to get bus impedance matrix.
Using bus building algorithm.
Using L-U factorization of Y-bus matrix.
A synchronous generator and a synchronous motor each rated 20MVA, 12.66KV
having 15% reactance are connected through transformers and a line as shown in fig.
the transformers are rated 20MVA,12.66/66KV and 66/12.66KV with leakage
reactance of 10% each. The line has a reactance of 8% on base of 20MVA, 66 KV.
The motor is drawing 10MW at 0.8 leading power factors and a terminal voltage
11KV when symmetrical three phase fault occurs at the motors terminals. Determine
the generator and motor currents. Also determine the fault current.
Solution
Reactance diagram
Equivalent circuit during fault condition
Three 11.2 KV generators are interconnected as shown in figure by a tie -bar through current
limiting reactors. A three phase feeder is supplied from the bus bar of generator A at line
voltage 11.2 KV. Impedance of the feeder is (0.12+j0.24) ohm per phase. Compute the
maximum MVA that can be fed into a symmetrical short circuit at the far end of the feeder.
Assume a zero pre-fault current (no load pre-fault condition).Circuit model for the
fault calculation is given
A 4 bus sample power system is shown in fig. Perform the short circuit analysis for a three
phase solid fault on bus 4.data are given below
G1: 11.2KV, 100MVA, X=0.08 p.u
T1: 11/110KV, 100MVA, X=0.06 p.u
T2: 11/110KV, 100MVA, X=0.06 p.u
Assume prefault voltages 1.0 p.u and prefault currents to be zero.
Two generators G1 and G2 are rated 15MVA, 11KV and 10MVA, 11KV
respectively. The generators are connected to a transformer as shown in fig. Calculate
the subtaransient current in each generator when a three phase fault occurs on the high
voltage side of the transformer.
A radial power system network is shown in fig. a three phase balanced fault occurs at
F. Determine the fault current and the line voltage at 11.8 KV bus under fault
condition.
A 100MVA,11KV generator with X’’=0.20 p.u is connected through a transformer
and line to a bus bar that supplies three identical motor as shown in fig. and each
motor has X’’=0.20 p.u and X’=0.25 p.u on a base of 20MVA,33KV.the bus voltage
at the motors is 33KV when a three phase balanced fault occurs at the point F.
Calculate
(a) subtransient current in the fault
(b) subtransient current in the circuit breaker B
(c) Momentary current in the circuit breaker B
(d) The current to be interrupted by CB B in (i) 2 cycles (ii) 3 cycles (iii) 5
cycles (iv) 8 cycles
1.
Obtain impedance matrix ZBUS for shown in figure.
Obtain impedance matrix ZBUS for shown in figure
Part-A
1.What is meant by a fault?
2.How the faults are classified?
3.List the symmetrical and unsymmetrical faults.
4.Write the relative frequency of occurrence of various types of faults.
5.What is the need for short circuit studies or fault analysis?
6.What is meant by doubling effect?
7.What are the main factors to be considered to select a circuit breaker?
8.Define short circuit interrupting of a circuit breaker.
9.Write equation for subtransient internal voltage and transient internal voltage of motor and
generator.
10.Find the momentary current through the circuit breaker if the initial symmetrical short
circuit current through it is 5270.9A.
Part-B
1). A synchronous generator and motor are rated for 30,000KVA,13.2KV and both have
subtransient reactance of 20%.The line connecting them has a reactance of 10% on the base
of machine ratings. The motor is drawing 20,000KW at 0.8 pf leading.The terminal voltage
of the motor is 12.8KV.When a symmetrical three-phase fault occurs at motor terminals,find
the subtransient current in generator,motor and at the fault point. (16)
2. Explain in detail about transients due to a short circuit in 3-Phase alternator and in
transmission line.
3.) A 3-phase ,5MVA,6.6KV alternator with a reactance of 8% is connected to a feeder of
series impedance of ).12+j0.48ohms/phase per km.The transformer is rated at
3MVA,6.6KV/33KV and has a reactance of 5%.Determine the fault current supplied by the
generator operating under no-load with a voltage of 6.9 kv, when a 3-phase symmetrical fault
occurs at a point 15km along the feeder. (16)
(
(a)Explain in detail about bus impedance matrix in fault calculations (8).
(b).Explain in detail about selection of circuit breakers. (8)
4) Explain about the symmetrical fault current estimation using kirchoff’s laws and using a
Thevenin’s theorem.
(7)
5. ) The bus impedance matrix of four bus system with values in p.u. is given by
If a 3-phase fault occurs at bus-1when there is no-load,find the subtransient current in
the fault and voltages at all buses.Also find the subtrasient current supplied by the generator
connected to bus-2 by taking the subtransient reactance of generator as j0.2 p.u.
UNIT- IV
SYMMETRICAL COMPONENTS AND UNBALANCED FAULT
ANALYSIS
Symmetrical component analysis of unsymmetrical faults – LG – LL – LLG faults – Open
conductor faults – Unbalanced fault analysis using bus impedance matrix.
Symmetrical components of a 3 phase system
In a 3 phase system, the unbalanced vectors (either currents or voltage) can be
resolved into three balanced system of vectors.
They are Positive sequence components
Negative sequence components
Zero sequence components
Unsymmetrical fault analysis can be done by using symmetrical components.
Positive sequence components
It consists of three components of equal magnitude, displaced each other by
120˚ in phase and having the phase sequence abc .
Negative sequence components
It consists of three components of equal magnitude, displaced each other by
120˚ in phase and having the phase sequence acb .
120˚
120˚
120˚ Ia1
Ib1
Ic1
Zero sequence components
It consists of three phasors equal in magnitude and with zero phase
displacement from each other.
Sequence operator
In unbalanced problem, to find the relationship between phase voltages and
phase currents, we use sequence operator ‘a’.
a = 1∠120˚ = = - 0.5+j0.866
Unbalanced currents from symmetrical currents
Let, Ia, Ib, Ic be the unbalanced phase currents
Let, Ia0, Ia1, Ia2 be the symmetrical components of phase a
120˚
120˚
120˚ Ia2
Ic2
Ib2
Ia0
Ib0
Ic0 Ia0 = Ib0 = Ic0
Determination of symmetrical currents from unbalanced currents.
Let, Ia, Ib, Ic be the unbalanced phase currents
Let, Ia0, Ia1, Ia2 be the symmetrical components of phase a
Sequence impedance and sequence network
The sequence impedances are the impedances offered by the power system
components or elements to +ve, -ve and zero sequence current.
The single phase equivalent circuit of power system consisting of impedances
to current of any one sequence only is called sequence network.
The phase voltage across a certain load are given as
Compute positive, negative and zero sequence component of voltage
Solution:
A balanced delta connected load is connected to a three phase system and supplied to
it is a current of 15 amps. If the fuse is one of the lines melts, compute the
symmetrical components of line currents.
Draw zero sequence network of the power system as shown in fig.
Draw zero sequence network of the power system as shown in fig. Data are given below.
A 50MVA, 11KV, synchronous generator has a sub transient reactance of 20%.The
generator supplies two motors over a transmission line with transformers at both ends
as shown in fig. The motors have rated inputs of 30 and 15 MVA, both 10KV, with
25% sub transient reactance. The three phase transformers are both rated 60MVA,
10.8/121KV, with leakage reactance of 10% each. Assume zero sequence reactance
for the generator and motors of 6% each. Current limiting reactors of 2.5 ohms each
are connected in the neutral of the generator and motor number 2. The zero sequence
reactance of the transmission line is 300 ohms. The series reactance of the line is 100
ohms. Draw the positive, negative and zero sequence networks.
A 30 MVA, 13.2KV synchronous generator has a solidly grounded neutral. Its
positive, negative and zero sequence impedances are 0.30, 0.40 and 0.05 p.u
respectively. Determine the following:
a) What value of reactance must be placed in the generator neutral so that
the fault current for a line to ground fault of zero fault impedance shall
not exceed the rated line current?
b) What value of resistance in the neutral will serve the same purpose?
c) What value of reactance must be placed in the neutral of the generator
to restrict the fault current to ground to rated line current for a double
line to ground fault?
d) What will be the magnitudes of the line currents when the ground
current is restricted as above?
e) As the reactance in the neutral is indefinitely increased, what are the
limiting values of the line currents?
2. Two alternators are operating in parallel and supplying a synchronous motor which
is receiving 60MW power at 0.8 power factor lagging at 6.0 KV. Single line
diagram for this system is given in fig. Data are given below. Compute the fault
current when a single line to ground fault occurs at the middle of the line through a
fault resistance of 4.033 ohm.
Part-A
1.What are the symmetrical components of a 3 phase system?
2.What are the positive sequence components?
3.What are the negative sequence components?
4.What is sequence operator?
5.Write down the equations to convert symmetrical components into
unbalanced phase currents. (Or) Determination of unbalanced currents from
symmetrical currents.
6.Write down the equations to convert unbalanced phase currents into
symmetrical components. (Or) Determination of symmetrical currents from
unbalanced currents.
.7What are sequence impedance and sequence network?
.8.Draw the positive, negative and zero sequence network of all power system
components.
--
9.Write the equation to determine fault current for L-G, L-L and L-L-G fault
with impedance.
10.Draw the equivalent sequence network diagram for L-G, L-L and L-L-G
fault .
Part-B
1.A balanced delta connected load is connected to a three phase system and supplied to it is a
current of 15 amps. If the fuse is one of the lines melts, compute the symmetrical components
of line currents
2.Draw zero sequence network of the power system as shown in fig.
3.A 50MVA, 11KV, synchronous generator has a sub transient reactance of 20%.The
generator supplies two motors over a transmission line with transformers at both ends as
shown in fig. The motors have rated inputs of 30 and 15 MVA, both 10KV, with 25%
sub transient reactance. The three phase transformers are both rated 60MVA,
10.8/121KV, with leakage reactance of 10% each. Assume zero sequence reactance for
the generator and motors of 6% each. Current limiting reactors of 2.5 ohms each are
connected in the neutral of the generator and motor number 2. The zero sequence
reactance of the transmission line is 300 ohms. The series reactance of the line is 100
ohms. Draw the positive, negative and zero sequence networks.
4.A 30 MVA, 13.2KV synchronous generator has a solidly grounded neutral. Its
positive, negative and zero sequence impedances are 0.30, 0.40 and 0.05 p.u
respectively. Determine the following:
f) What value of reactance must be placed in the generator neutral so that
the fault current for a line to ground fault of zero fault impedance shall
not exceed the rated line current?
g) What value of resistance in the neutral will serve the same purpose?
h) What value of reactance must be placed in the neutral of the generator
to restrict the fault current to ground to rated line current for a double
line to ground fault?
i) What will be the magnitudes of the line currents when the ground
current is restricted as above?
j) As the reactance in the neutral is indefinitely increased, what are the
limiting values of the line currents?
UNIT- V
POWER SYSTEM STABILITY
Rotor dynamics and swing equation – Stability classification – Small signal stability – Large
signal
stability – Equal area criterion and solution of SMIB system problems – Solution of swing
equation – Point-by-point method, R-K method and modified euler method – Techniques for
stability improvement.
power system stability
The stability of an interconnected power system means is the ability of the
power system is to return or regain to normal or stable operating condition after
having been subjected to some form of disturbance.
Power system stability is classified
Rotor angle stability
Rotor angle stability is the ability of interconnected synchronous machines of
a power system to remain in synchronism.
steady state stability
Steady state stability is defined as the ability of the power system to bring it to
a stable condition or remain in synchronism after a small disturbance.
Steady state stability limit
The steady sate stability limit is the maximum power that can be transferred
by a machine to receiving system without loss of synchronism
Transient stability
Transient stability is defined as the ability of the power system to bring it to a
stable condition or remain in synchronism after a large disturbance.
transient stability limit
The transient stability limit is the maximum power that can be transferred by a
machine to a fault or a receiving system during a transient state without loss of
synchronism.
Transient stability limit is always less than steady state stability limit
Dynamic stability
It is the ability of a power system to remain in synchronism after the initial
swing (transient stability period) until the system has settled down to the new steady
state equilibrium condition
Voltage stability
It is the ability of a power system to maintain steady acceptable voltages at all
buses in the system under normal operating conditions and after being subjected to a
disturbance.
Causes of voltage instability
A system enters a state of voltage instability when a disturbance, increase in
load demand, or change in system condition causes a progressive and uncontrollable
drop in voltage
The main factor causing instability is the inability of the power system to meet
the demand for reactive power.
Power angle equation and draw the power angle curve
Where, P – Real Power in watts
Vs – Sending end voltage; Vr- Receiving end voltage
XT - Total reactance between sending end receiving end
- Rotor angle.
Maximum power transfer.
Swing equation for a SMIB (Single machine connected to an infinite bus bar)
system.
M
Where H = inertia constant in MW/MVA
f = frequency in Hz
M = inertia constant in p.u
Swing curve
The swing curve is the plot or graph between the power angle δ and time t.
From the nature of variations of δ the stability of a system for any disturbance can be
determined.
3 machine system having ratings G1, G2 and G3 and inertia constants M1, M2 and
M3.What is the inertia constants M and H of the equivalent system.
Where G1, G2, G3 – MVA rating of machines 1, 2, and 3
Gb = Base MVA or system MVA
Assumptions made in stability studies.
Machines represents by classical model
The losses in the system are neglected (all resistance are neglected)
The voltage behind transient reactance is assumed to remain constant.
Controllers are not considered ( Shunt and series capacitor )
Effect of damper winding is neglected.
Equal Area Criterion
The equal area criterion for stability states that the system is stable if the area
under P – δ curve reduces to zero at some value of δ.
This is possible if the positive (accelerating) area under P – δ curve is equal to
the negative (decelerating) area under P – δ curve for a finite change in δ. hence
stability criterion is called equal area criterion.
Critical clearing angle.
The critical clearing angle , is the maximum allowable change in the power
angle δ before clearing the fault, without loss of synchronism.
The time corresponding to this angle is called critical clearing time, .It can
be defined as the maximum time delay that can be allowed to clear a fault without loss
of synchronism.
Methods of improving the transient stability limit of a power system.
Reduction in system transfer reactance
Increase of system voltage and use AVR
Use of high speed excitation systems
Use of high speed reclosing breakers
Numerical integration methods of power system stability
i. Point by point method or step by step method
ii. Euler method
iii. Modified Euler method
iv. Runge-Kutta method(R-K method)
swing equation for a single machine connected to infinite bus system.
A 400 MVA synchronous machine has H1=4.6 MJ/MVA and a 1200 MVA machines
H2=3.0 MJ/MVA. Two machines operate in parallel in a power plant. Find out Heq
relative to a 100MVA base.
A 100 MVA, two pole, 50Hz generator has moment of inertia 40 x 103
kg-m2
.what is
the energy stored in the rotor at the rated speed? What is the corresponding angular
momentum? Determine the inertia constant h.
The sending end and receiving end voltages of a three phase transmission line at a
200MW load are equal at 230KV.The per phase line impedance is j14 ohm. Calculate
the maximum steady state power that can be transmitted over the line.
Equal area criterion in transient stability.
A single line diagram of a system is shown in fig. All the values are in per unit on a common
base. The power delivered into bus 2 is 1.0 p.u at 0.80 power factor lagging. Obtain the
power angle equation and the swing equation for the system. Neglect all losses.
Explain critical clearing angle and critical clearing time in transient stability.
A 50Hz synchronous generator capable of supplying 400MW of power is connected to a
larger power system and is delivering 80MW when a three phase fault occurs at its terminals,
determine (a) the time in which the fault must be cleared if the maximum power angle is to be
-85˚ assume H=7MJ/MVA on a 100MVA base (b) the critical clearing angle.
A 2220 MVA, 24KV and 60 Hz synchronous machine is connected to an infinite bus
through transformer and double circuit transmission line, as shown in fig. The infinite
bus voltage V=1.0 p.u .The direct axis transient reactance of the machine is 0.30 p.u,
the transformer reactance is 0.20 p.u, and the reactance of each the transmission line
is 0.3 p.u,all to a base of the rating of the synchronous machine. Initially, the machine
is delivering 0.8 p.u real power and reactive power is 0.074 p.u with a terminal
voltage of 1.0 p.u. The inertia constant H=5MJ/MVA. All resistances are neglected. A
three phase fault occurs at the sending end of one of the lines, the fault is cleared, and
the faulted line is isolated. Determine the critical clearing angle and the critical fault
clearing time.
The current flowing into the infinite bus is
The transfer reactance between internal voltage and the infinite bus before
fault is
X = Xg +XT +Xtr.line
X = 0.3 + 0.2 +0.3/2 = 0.65
The transient internal voltage is
E = V +j X I = 1.0+ (j0.65) (0.8- j0.074)
= 1.17
Since both lines are intact when the fault is cleared, the power angle equation
before and after the fault is
The initial operating angle is given by = 0.8
δ0 = 26.388 = 0.46055 rad
δmax =180º - δ0 = 153.612 =2.681rad
Critical clearing angle
δc =
Critical clearing time tc = = = 0.26 second
A synchronous generator is connected to a large power system and supplying 0.45 pu
MW of its maximum power capacity. A three phase fault occurs and the effective
terminal voltage of the generator becomes 25% of its value before the fault. When the
fault is cleared, generator is delivering 70% of the original maximum value.
Determine the critical clearing angle.
Find the critical clearing angle of the power system shown in fig. for a three phase
fault at the point F. Generator is supplying 1.0 p.u MW power under pre-fault
condition.
Factors influencing transient stability
Numerical integration methods of power system stability? Explain any one methods.
v. Point by point method or step by step method
vi. Euler method
vii. Modified Euler method
viii. Runge-Kutta method(R-K method)
Step by step method
Part-A
1What is power system stability?
2.How power system stability is classified?
3.What is rotor angle stability?
4.What is steady state stability?
5.What is steady state stability limit?
6.What is transient stability?
7.What is transient stability limit?
8.What is dynamic stability?
9.What is voltage stability?
10.State the causes of voltage instability.
.
11.Write the power angle equation and draw the power angle curve.
Part-B
1.Derive swing equation for a single machine connected to infinite bus system
1. A 400 MVA synchronous machine has H1=4.6 MJ/MVA and a 1200 MVA
machines H2=3.0 MJ/MVA. Two machines operate in parallel in a power plant.
Find out Heq relative to a 100MVA base.
2.
A 100 MVA, two pole, 50Hz generator has moment of inertia 40 x 103
kg-
m2
.what is the energy stored in the rotor at the rated speed? What is the
corresponding angular momentum? Determine the inertia constant h
3. The sending end and receiving end voltages of a three phase transmission line at
a 200MW load are equal at 230KV.The per phase line impedance is j14 ohm.
Calculate the maximum steady state power that can be transmitted over the
line.
Power System Analysis!

More Related Content

What's hot

Voltage source Converters as a building block of HVDC and FACTS
Voltage source Converters as a building block of HVDC and FACTSVoltage source Converters as a building block of HVDC and FACTS
Voltage source Converters as a building block of HVDC and FACTSKarthik Bharadwaj
 
Protective relay
Protective relay Protective relay
Protective relay Uday Wankar
 
Flexible ac transmission system
Flexible ac transmission systemFlexible ac transmission system
Flexible ac transmission systemUday Wankar
 
importance of reactive power in power system
importance of reactive power in power systemimportance of reactive power in power system
importance of reactive power in power systemsneh pratap singh
 
Power system fault analysis ppt
Power system fault analysis pptPower system fault analysis ppt
Power system fault analysis pptkarikalan123
 
final year project report
final year project reportfinal year project report
final year project reportAnuj Kumar
 
Vector Control of AC Induction Motors
Vector Control of AC Induction MotorsVector Control of AC Induction Motors
Vector Control of AC Induction MotorsPranjal Barman
 
Automatic Generation Control
Automatic Generation ControlAutomatic Generation Control
Automatic Generation ControlBirju Besra
 
Introduction to power system analysis
Introduction to power system analysisIntroduction to power system analysis
Introduction to power system analysisRevathi Subramaniam
 
FACTS DEVICES AND POWER SYSTEM STABILITY ppt
FACTS DEVICES AND POWER SYSTEM STABILITY pptFACTS DEVICES AND POWER SYSTEM STABILITY ppt
FACTS DEVICES AND POWER SYSTEM STABILITY pptMamta Bagoria
 
Automatic load frequency control
Automatic load frequency controlAutomatic load frequency control
Automatic load frequency controlBalaram Das
 
Unit 04 Protection of generators and transformers
Unit  04 Protection of generators and transformers Unit  04 Protection of generators and transformers
Unit 04 Protection of generators and transformers PremanandDesai
 
POWER SYSTEM PROTECTION
POWER SYSTEM PROTECTION POWER SYSTEM PROTECTION
POWER SYSTEM PROTECTION moiz89
 

What's hot (20)

Voltage source Converters as a building block of HVDC and FACTS
Voltage source Converters as a building block of HVDC and FACTSVoltage source Converters as a building block of HVDC and FACTS
Voltage source Converters as a building block of HVDC and FACTS
 
Reactive power compensation
Reactive power compensationReactive power compensation
Reactive power compensation
 
Protective relay
Protective relay Protective relay
Protective relay
 
Flexible ac transmission system
Flexible ac transmission systemFlexible ac transmission system
Flexible ac transmission system
 
Swing equation
Swing equationSwing equation
Swing equation
 
importance of reactive power in power system
importance of reactive power in power systemimportance of reactive power in power system
importance of reactive power in power system
 
Power system fault analysis ppt
Power system fault analysis pptPower system fault analysis ppt
Power system fault analysis ppt
 
Fault analysis using z bus
Fault analysis using z busFault analysis using z bus
Fault analysis using z bus
 
final year project report
final year project reportfinal year project report
final year project report
 
Vector Control of AC Induction Motors
Vector Control of AC Induction MotorsVector Control of AC Induction Motors
Vector Control of AC Induction Motors
 
Automatic Generation Control
Automatic Generation ControlAutomatic Generation Control
Automatic Generation Control
 
Introduction to power system analysis
Introduction to power system analysisIntroduction to power system analysis
Introduction to power system analysis
 
State estimation
State estimationState estimation
State estimation
 
FACTS DEVICES AND POWER SYSTEM STABILITY ppt
FACTS DEVICES AND POWER SYSTEM STABILITY pptFACTS DEVICES AND POWER SYSTEM STABILITY ppt
FACTS DEVICES AND POWER SYSTEM STABILITY ppt
 
Automatic load frequency control
Automatic load frequency controlAutomatic load frequency control
Automatic load frequency control
 
Thyristor switched capacitor
Thyristor switched capacitorThyristor switched capacitor
Thyristor switched capacitor
 
Power flow analysis
Power flow analysisPower flow analysis
Power flow analysis
 
Unit 04 Protection of generators and transformers
Unit  04 Protection of generators and transformers Unit  04 Protection of generators and transformers
Unit 04 Protection of generators and transformers
 
POWER SYSTEM PROTECTION
POWER SYSTEM PROTECTION POWER SYSTEM PROTECTION
POWER SYSTEM PROTECTION
 
Svpwm
SvpwmSvpwm
Svpwm
 

Viewers also liked

Power system analysis material -Mathankumar.s VMKVEC
Power system analysis material -Mathankumar.s  VMKVECPower system analysis material -Mathankumar.s  VMKVEC
Power system analysis material -Mathankumar.s VMKVECMathankumar S
 
power system analysis PPT
power system analysis PPTpower system analysis PPT
power system analysis PPTZiyaulhaq
 
POWER SYSTEM SIMULATION LAB-1 MANUAL (ELECTRICAL - POWER SYSTEM ENGINEERING )
POWER SYSTEM SIMULATION LAB-1 MANUAL (ELECTRICAL - POWER SYSTEM ENGINEERING )POWER SYSTEM SIMULATION LAB-1 MANUAL (ELECTRICAL - POWER SYSTEM ENGINEERING )
POWER SYSTEM SIMULATION LAB-1 MANUAL (ELECTRICAL - POWER SYSTEM ENGINEERING )Mathankumar S
 
ANN for Load Flow Studies
ANN for Load Flow StudiesANN for Load Flow Studies
ANN for Load Flow Studiesmjvshin
 

Viewers also liked (8)

load flow 1
 load flow 1 load flow 1
load flow 1
 
Power system-analysis-psr murthy
Power system-analysis-psr murthyPower system-analysis-psr murthy
Power system-analysis-psr murthy
 
Power system analysis material -Mathankumar.s VMKVEC
Power system analysis material -Mathankumar.s  VMKVECPower system analysis material -Mathankumar.s  VMKVEC
Power system analysis material -Mathankumar.s VMKVEC
 
power system analysis PPT
power system analysis PPTpower system analysis PPT
power system analysis PPT
 
Electric power system
Electric power systemElectric power system
Electric power system
 
POWER SYSTEM SIMULATION LAB-1 MANUAL (ELECTRICAL - POWER SYSTEM ENGINEERING )
POWER SYSTEM SIMULATION LAB-1 MANUAL (ELECTRICAL - POWER SYSTEM ENGINEERING )POWER SYSTEM SIMULATION LAB-1 MANUAL (ELECTRICAL - POWER SYSTEM ENGINEERING )
POWER SYSTEM SIMULATION LAB-1 MANUAL (ELECTRICAL - POWER SYSTEM ENGINEERING )
 
Load flow study
Load flow studyLoad flow study
Load flow study
 
ANN for Load Flow Studies
ANN for Load Flow StudiesANN for Load Flow Studies
ANN for Load Flow Studies
 

Similar to Power System Analysis!

Assignment 1 170901 interconnected power system
Assignment 1 170901 interconnected power systemAssignment 1 170901 interconnected power system
Assignment 1 170901 interconnected power systemVara Prasad
 
Assignment 1 170901 interconnected power system
Assignment 1 170901 interconnected power systemAssignment 1 170901 interconnected power system
Assignment 1 170901 interconnected power systemVara Prasad
 
POWER SYSTEM ANALYSIS_254ppt.pdf
POWER SYSTEM ANALYSIS_254ppt.pdfPOWER SYSTEM ANALYSIS_254ppt.pdf
POWER SYSTEM ANALYSIS_254ppt.pdfMillionAlemayehu2
 
CHAPTER 3 - Three Phase Network.ppt
CHAPTER 3 - Three Phase Network.pptCHAPTER 3 - Three Phase Network.ppt
CHAPTER 3 - Three Phase Network.pptLiewChiaPing
 
Power-System-Slide-1.pptx
Power-System-Slide-1.pptxPower-System-Slide-1.pptx
Power-System-Slide-1.pptxssuser99d6551
 
Week 8 The per unit system lecture notes
Week 8 The per unit system lecture notesWeek 8 The per unit system lecture notes
Week 8 The per unit system lecture notesmonaibrahim598401
 
Unit -1 Introdcution to PSA.pptx
Unit -1  Introdcution to PSA.pptxUnit -1  Introdcution to PSA.pptx
Unit -1 Introdcution to PSA.pptxSanjeevKumarkumar11
 
Augmentation of Real & Reactive Power in Grid by Unified Power Flow Controller
Augmentation of Real & Reactive Power in Grid by Unified Power Flow ControllerAugmentation of Real & Reactive Power in Grid by Unified Power Flow Controller
Augmentation of Real & Reactive Power in Grid by Unified Power Flow ControllerIJERA Editor
 
1_Intro + Per Unit.pdf
1_Intro + Per Unit.pdf1_Intro + Per Unit.pdf
1_Intro + Per Unit.pdfLiewChiaPing
 
chapter_1_per_unit_power system_august_2011.ppt
chapter_1_per_unit_power system_august_2011.pptchapter_1_per_unit_power system_august_2011.ppt
chapter_1_per_unit_power system_august_2011.pptRachmadi8
 
Small Signal Modeling Of Controller For Statcom Used In Distribution System F...
Small Signal Modeling Of Controller For Statcom Used In Distribution System F...Small Signal Modeling Of Controller For Statcom Used In Distribution System F...
Small Signal Modeling Of Controller For Statcom Used In Distribution System F...IJERA Editor
 
Simulation And Hardware Analysis Of Three Phase PWM Rectifier With Power Fact...
Simulation And Hardware Analysis Of Three Phase PWM Rectifier With Power Fact...Simulation And Hardware Analysis Of Three Phase PWM Rectifier With Power Fact...
Simulation And Hardware Analysis Of Three Phase PWM Rectifier With Power Fact...IOSR Journals
 
Grid Interfaced 3-phase Solar Inverter with MPPT by using Boost Converter
Grid Interfaced 3-phase Solar Inverter with MPPT by using Boost ConverterGrid Interfaced 3-phase Solar Inverter with MPPT by using Boost Converter
Grid Interfaced 3-phase Solar Inverter with MPPT by using Boost ConverterIJMTST Journal
 
Power system Analysis By Sharif Kakar
Power system Analysis   By Sharif KakarPower system Analysis   By Sharif Kakar
Power system Analysis By Sharif KakarSharif Ullah
 

Similar to Power System Analysis! (20)

Electrical power system
Electrical power system Electrical power system
Electrical power system
 
Assignment 1 170901 interconnected power system
Assignment 1 170901 interconnected power systemAssignment 1 170901 interconnected power system
Assignment 1 170901 interconnected power system
 
Assignment 1 170901 interconnected power system
Assignment 1 170901 interconnected power systemAssignment 1 170901 interconnected power system
Assignment 1 170901 interconnected power system
 
POWER SYSTEM ANALYSIS_254ppt.pdf
POWER SYSTEM ANALYSIS_254ppt.pdfPOWER SYSTEM ANALYSIS_254ppt.pdf
POWER SYSTEM ANALYSIS_254ppt.pdf
 
CHAPTER 3 - Three Phase Network.ppt
CHAPTER 3 - Three Phase Network.pptCHAPTER 3 - Three Phase Network.ppt
CHAPTER 3 - Three Phase Network.ppt
 
Power-System-Slide-1.pptx
Power-System-Slide-1.pptxPower-System-Slide-1.pptx
Power-System-Slide-1.pptx
 
Week 8 The per unit system lecture notes
Week 8 The per unit system lecture notesWeek 8 The per unit system lecture notes
Week 8 The per unit system lecture notes
 
A0411030109
A0411030109A0411030109
A0411030109
 
Unit -1 Introdcution to PSA.pptx
Unit -1  Introdcution to PSA.pptxUnit -1  Introdcution to PSA.pptx
Unit -1 Introdcution to PSA.pptx
 
F0363028034
F0363028034F0363028034
F0363028034
 
Augmentation of Real & Reactive Power in Grid by Unified Power Flow Controller
Augmentation of Real & Reactive Power in Grid by Unified Power Flow ControllerAugmentation of Real & Reactive Power in Grid by Unified Power Flow Controller
Augmentation of Real & Reactive Power in Grid by Unified Power Flow Controller
 
1_Intro + Per Unit.pdf
1_Intro + Per Unit.pdf1_Intro + Per Unit.pdf
1_Intro + Per Unit.pdf
 
P.u systems.pptx
P.u systems.pptxP.u systems.pptx
P.u systems.pptx
 
I41045662
I41045662I41045662
I41045662
 
chapter_1_per_unit_power system_august_2011.ppt
chapter_1_per_unit_power system_august_2011.pptchapter_1_per_unit_power system_august_2011.ppt
chapter_1_per_unit_power system_august_2011.ppt
 
Small Signal Modeling Of Controller For Statcom Used In Distribution System F...
Small Signal Modeling Of Controller For Statcom Used In Distribution System F...Small Signal Modeling Of Controller For Statcom Used In Distribution System F...
Small Signal Modeling Of Controller For Statcom Used In Distribution System F...
 
Simulation And Hardware Analysis Of Three Phase PWM Rectifier With Power Fact...
Simulation And Hardware Analysis Of Three Phase PWM Rectifier With Power Fact...Simulation And Hardware Analysis Of Three Phase PWM Rectifier With Power Fact...
Simulation And Hardware Analysis Of Three Phase PWM Rectifier With Power Fact...
 
Grid Interfaced 3-phase Solar Inverter with MPPT by using Boost Converter
Grid Interfaced 3-phase Solar Inverter with MPPT by using Boost ConverterGrid Interfaced 3-phase Solar Inverter with MPPT by using Boost Converter
Grid Interfaced 3-phase Solar Inverter with MPPT by using Boost Converter
 
Lecture1
Lecture1Lecture1
Lecture1
 
Power system Analysis By Sharif Kakar
Power system Analysis   By Sharif KakarPower system Analysis   By Sharif Kakar
Power system Analysis By Sharif Kakar
 

More from PRABHAHARAN429

Professional Ethics and Human Values
Professional Ethics and Human ValuesProfessional Ethics and Human Values
Professional Ethics and Human ValuesPRABHAHARAN429
 
MAKING OF LINE FOLLOWER ROBOT
MAKING OF LINE FOLLOWER ROBOTMAKING OF LINE FOLLOWER ROBOT
MAKING OF LINE FOLLOWER ROBOTPRABHAHARAN429
 
Digital Signal Processing
Digital Signal ProcessingDigital Signal Processing
Digital Signal ProcessingPRABHAHARAN429
 
Environmental Science!
Environmental Science!Environmental Science!
Environmental Science!PRABHAHARAN429
 
Linear Integrated Circuits -LIC!
Linear Integrated Circuits -LIC!Linear Integrated Circuits -LIC!
Linear Integrated Circuits -LIC!PRABHAHARAN429
 
Electrical drives lectures
Electrical drives lecturesElectrical drives lectures
Electrical drives lecturesPRABHAHARAN429
 
Micro Processor Lab Manual!
Micro Processor Lab Manual!Micro Processor Lab Manual!
Micro Processor Lab Manual!PRABHAHARAN429
 
Microprocessor and Microcontroller Lab Manual!
Microprocessor and Microcontroller Lab Manual!Microprocessor and Microcontroller Lab Manual!
Microprocessor and Microcontroller Lab Manual!PRABHAHARAN429
 
Grid Integration Of Large Scale!
Grid Integration Of Large Scale!Grid Integration Of Large Scale!
Grid Integration Of Large Scale!PRABHAHARAN429
 
Electromagnetic Theory
Electromagnetic TheoryElectromagnetic Theory
Electromagnetic TheoryPRABHAHARAN429
 
Electron Device Control
Electron Device ControlElectron Device Control
Electron Device ControlPRABHAHARAN429
 
Transmission and Distribution.
Transmission and Distribution.Transmission and Distribution.
Transmission and Distribution.PRABHAHARAN429
 
Very Large Scale Integration -VLSI
Very Large Scale Integration -VLSIVery Large Scale Integration -VLSI
Very Large Scale Integration -VLSIPRABHAHARAN429
 
Measurement & Instrumentation (BE)
Measurement & Instrumentation (BE)Measurement & Instrumentation (BE)
Measurement & Instrumentation (BE)PRABHAHARAN429
 
Control For Renewable Energy & Smart Grids
Control For Renewable Energy & Smart GridsControl For Renewable Energy & Smart Grids
Control For Renewable Energy & Smart GridsPRABHAHARAN429
 
IQ Gym Grow Your Mind.
IQ Gym Grow Your Mind.IQ Gym Grow Your Mind.
IQ Gym Grow Your Mind.PRABHAHARAN429
 

More from PRABHAHARAN429 (20)

Professional Ethics and Human Values
Professional Ethics and Human ValuesProfessional Ethics and Human Values
Professional Ethics and Human Values
 
NUMERICAL METHODS
NUMERICAL METHODSNUMERICAL METHODS
NUMERICAL METHODS
 
MAKING OF LINE FOLLOWER ROBOT
MAKING OF LINE FOLLOWER ROBOTMAKING OF LINE FOLLOWER ROBOT
MAKING OF LINE FOLLOWER ROBOT
 
Digital Signal Processing
Digital Signal ProcessingDigital Signal Processing
Digital Signal Processing
 
Environmental Science!
Environmental Science!Environmental Science!
Environmental Science!
 
Linear Integrated Circuits -LIC!
Linear Integrated Circuits -LIC!Linear Integrated Circuits -LIC!
Linear Integrated Circuits -LIC!
 
Oops
OopsOops
Oops
 
Electrical drives lectures
Electrical drives lecturesElectrical drives lectures
Electrical drives lectures
 
Micro Processor Lab Manual!
Micro Processor Lab Manual!Micro Processor Lab Manual!
Micro Processor Lab Manual!
 
Microprocessor and Microcontroller Lab Manual!
Microprocessor and Microcontroller Lab Manual!Microprocessor and Microcontroller Lab Manual!
Microprocessor and Microcontroller Lab Manual!
 
Grid Integration Of Large Scale!
Grid Integration Of Large Scale!Grid Integration Of Large Scale!
Grid Integration Of Large Scale!
 
Electromagnetic Theory
Electromagnetic TheoryElectromagnetic Theory
Electromagnetic Theory
 
Electron Device Control
Electron Device ControlElectron Device Control
Electron Device Control
 
8051 Micro Controller
8051 Micro Controller8051 Micro Controller
8051 Micro Controller
 
Transmission and Distribution.
Transmission and Distribution.Transmission and Distribution.
Transmission and Distribution.
 
Very Large Scale Integration -VLSI
Very Large Scale Integration -VLSIVery Large Scale Integration -VLSI
Very Large Scale Integration -VLSI
 
Measurement & Instrumentation (BE)
Measurement & Instrumentation (BE)Measurement & Instrumentation (BE)
Measurement & Instrumentation (BE)
 
Control For Renewable Energy & Smart Grids
Control For Renewable Energy & Smart GridsControl For Renewable Energy & Smart Grids
Control For Renewable Energy & Smart Grids
 
IQ Gym Grow Your Mind.
IQ Gym Grow Your Mind.IQ Gym Grow Your Mind.
IQ Gym Grow Your Mind.
 
Data Structures (BE)
Data Structures (BE)Data Structures (BE)
Data Structures (BE)
 

Recently uploaded

ICS2208 Lecture6 Notes for SL spaces.pdf
ICS2208 Lecture6 Notes for SL spaces.pdfICS2208 Lecture6 Notes for SL spaces.pdf
ICS2208 Lecture6 Notes for SL spaces.pdfVanessa Camilleri
 
Grade 9 Quarter 4 Dll Grade 9 Quarter 4 DLL.pdf
Grade 9 Quarter 4 Dll Grade 9 Quarter 4 DLL.pdfGrade 9 Quarter 4 Dll Grade 9 Quarter 4 DLL.pdf
Grade 9 Quarter 4 Dll Grade 9 Quarter 4 DLL.pdfJemuel Francisco
 
Active Learning Strategies (in short ALS).pdf
Active Learning Strategies (in short ALS).pdfActive Learning Strategies (in short ALS).pdf
Active Learning Strategies (in short ALS).pdfPatidar M
 
4.11.24 Mass Incarceration and the New Jim Crow.pptx
4.11.24 Mass Incarceration and the New Jim Crow.pptx4.11.24 Mass Incarceration and the New Jim Crow.pptx
4.11.24 Mass Incarceration and the New Jim Crow.pptxmary850239
 
Blowin' in the Wind of Caste_ Bob Dylan's Song as a Catalyst for Social Justi...
Blowin' in the Wind of Caste_ Bob Dylan's Song as a Catalyst for Social Justi...Blowin' in the Wind of Caste_ Bob Dylan's Song as a Catalyst for Social Justi...
Blowin' in the Wind of Caste_ Bob Dylan's Song as a Catalyst for Social Justi...DhatriParmar
 
Textual Evidence in Reading and Writing of SHS
Textual Evidence in Reading and Writing of SHSTextual Evidence in Reading and Writing of SHS
Textual Evidence in Reading and Writing of SHSMae Pangan
 
MS4 level being good citizen -imperative- (1) (1).pdf
MS4 level   being good citizen -imperative- (1) (1).pdfMS4 level   being good citizen -imperative- (1) (1).pdf
MS4 level being good citizen -imperative- (1) (1).pdfMr Bounab Samir
 
Unraveling Hypertext_ Analyzing Postmodern Elements in Literature.pptx
Unraveling Hypertext_ Analyzing  Postmodern Elements in  Literature.pptxUnraveling Hypertext_ Analyzing  Postmodern Elements in  Literature.pptx
Unraveling Hypertext_ Analyzing Postmodern Elements in Literature.pptxDhatriParmar
 
ClimART Action | eTwinning Project
ClimART Action    |    eTwinning ProjectClimART Action    |    eTwinning Project
ClimART Action | eTwinning Projectjordimapav
 
ARTERIAL BLOOD GAS ANALYSIS........pptx
ARTERIAL BLOOD  GAS ANALYSIS........pptxARTERIAL BLOOD  GAS ANALYSIS........pptx
ARTERIAL BLOOD GAS ANALYSIS........pptxAneriPatwari
 
Using Grammatical Signals Suitable to Patterns of Idea Development
Using Grammatical Signals Suitable to Patterns of Idea DevelopmentUsing Grammatical Signals Suitable to Patterns of Idea Development
Using Grammatical Signals Suitable to Patterns of Idea Developmentchesterberbo7
 
How to Manage Buy 3 Get 1 Free in Odoo 17
How to Manage Buy 3 Get 1 Free in Odoo 17How to Manage Buy 3 Get 1 Free in Odoo 17
How to Manage Buy 3 Get 1 Free in Odoo 17Celine George
 
Daily Lesson Plan in Mathematics Quarter 4
Daily Lesson Plan in Mathematics Quarter 4Daily Lesson Plan in Mathematics Quarter 4
Daily Lesson Plan in Mathematics Quarter 4JOYLYNSAMANIEGO
 
CLASSIFICATION OF ANTI - CANCER DRUGS.pptx
CLASSIFICATION OF ANTI - CANCER DRUGS.pptxCLASSIFICATION OF ANTI - CANCER DRUGS.pptx
CLASSIFICATION OF ANTI - CANCER DRUGS.pptxAnupam32727
 
Q-Factor HISPOL Quiz-6th April 2024, Quiz Club NITW
Q-Factor HISPOL Quiz-6th April 2024, Quiz Club NITWQ-Factor HISPOL Quiz-6th April 2024, Quiz Club NITW
Q-Factor HISPOL Quiz-6th April 2024, Quiz Club NITWQuiz Club NITW
 
How to Fix XML SyntaxError in Odoo the 17
How to Fix XML SyntaxError in Odoo the 17How to Fix XML SyntaxError in Odoo the 17
How to Fix XML SyntaxError in Odoo the 17Celine George
 
Mythology Quiz-4th April 2024, Quiz Club NITW
Mythology Quiz-4th April 2024, Quiz Club NITWMythology Quiz-4th April 2024, Quiz Club NITW
Mythology Quiz-4th April 2024, Quiz Club NITWQuiz Club NITW
 
Q-Factor General Quiz-7th April 2024, Quiz Club NITW
Q-Factor General Quiz-7th April 2024, Quiz Club NITWQ-Factor General Quiz-7th April 2024, Quiz Club NITW
Q-Factor General Quiz-7th April 2024, Quiz Club NITWQuiz Club NITW
 
Expanded definition: technical and operational
Expanded definition: technical and operationalExpanded definition: technical and operational
Expanded definition: technical and operationalssuser3e220a
 
Team Lead Succeed – Helping you and your team achieve high-performance teamwo...
Team Lead Succeed – Helping you and your team achieve high-performance teamwo...Team Lead Succeed – Helping you and your team achieve high-performance teamwo...
Team Lead Succeed – Helping you and your team achieve high-performance teamwo...Association for Project Management
 

Recently uploaded (20)

ICS2208 Lecture6 Notes for SL spaces.pdf
ICS2208 Lecture6 Notes for SL spaces.pdfICS2208 Lecture6 Notes for SL spaces.pdf
ICS2208 Lecture6 Notes for SL spaces.pdf
 
Grade 9 Quarter 4 Dll Grade 9 Quarter 4 DLL.pdf
Grade 9 Quarter 4 Dll Grade 9 Quarter 4 DLL.pdfGrade 9 Quarter 4 Dll Grade 9 Quarter 4 DLL.pdf
Grade 9 Quarter 4 Dll Grade 9 Quarter 4 DLL.pdf
 
Active Learning Strategies (in short ALS).pdf
Active Learning Strategies (in short ALS).pdfActive Learning Strategies (in short ALS).pdf
Active Learning Strategies (in short ALS).pdf
 
4.11.24 Mass Incarceration and the New Jim Crow.pptx
4.11.24 Mass Incarceration and the New Jim Crow.pptx4.11.24 Mass Incarceration and the New Jim Crow.pptx
4.11.24 Mass Incarceration and the New Jim Crow.pptx
 
Blowin' in the Wind of Caste_ Bob Dylan's Song as a Catalyst for Social Justi...
Blowin' in the Wind of Caste_ Bob Dylan's Song as a Catalyst for Social Justi...Blowin' in the Wind of Caste_ Bob Dylan's Song as a Catalyst for Social Justi...
Blowin' in the Wind of Caste_ Bob Dylan's Song as a Catalyst for Social Justi...
 
Textual Evidence in Reading and Writing of SHS
Textual Evidence in Reading and Writing of SHSTextual Evidence in Reading and Writing of SHS
Textual Evidence in Reading and Writing of SHS
 
MS4 level being good citizen -imperative- (1) (1).pdf
MS4 level   being good citizen -imperative- (1) (1).pdfMS4 level   being good citizen -imperative- (1) (1).pdf
MS4 level being good citizen -imperative- (1) (1).pdf
 
Unraveling Hypertext_ Analyzing Postmodern Elements in Literature.pptx
Unraveling Hypertext_ Analyzing  Postmodern Elements in  Literature.pptxUnraveling Hypertext_ Analyzing  Postmodern Elements in  Literature.pptx
Unraveling Hypertext_ Analyzing Postmodern Elements in Literature.pptx
 
ClimART Action | eTwinning Project
ClimART Action    |    eTwinning ProjectClimART Action    |    eTwinning Project
ClimART Action | eTwinning Project
 
ARTERIAL BLOOD GAS ANALYSIS........pptx
ARTERIAL BLOOD  GAS ANALYSIS........pptxARTERIAL BLOOD  GAS ANALYSIS........pptx
ARTERIAL BLOOD GAS ANALYSIS........pptx
 
Using Grammatical Signals Suitable to Patterns of Idea Development
Using Grammatical Signals Suitable to Patterns of Idea DevelopmentUsing Grammatical Signals Suitable to Patterns of Idea Development
Using Grammatical Signals Suitable to Patterns of Idea Development
 
How to Manage Buy 3 Get 1 Free in Odoo 17
How to Manage Buy 3 Get 1 Free in Odoo 17How to Manage Buy 3 Get 1 Free in Odoo 17
How to Manage Buy 3 Get 1 Free in Odoo 17
 
Daily Lesson Plan in Mathematics Quarter 4
Daily Lesson Plan in Mathematics Quarter 4Daily Lesson Plan in Mathematics Quarter 4
Daily Lesson Plan in Mathematics Quarter 4
 
CLASSIFICATION OF ANTI - CANCER DRUGS.pptx
CLASSIFICATION OF ANTI - CANCER DRUGS.pptxCLASSIFICATION OF ANTI - CANCER DRUGS.pptx
CLASSIFICATION OF ANTI - CANCER DRUGS.pptx
 
Q-Factor HISPOL Quiz-6th April 2024, Quiz Club NITW
Q-Factor HISPOL Quiz-6th April 2024, Quiz Club NITWQ-Factor HISPOL Quiz-6th April 2024, Quiz Club NITW
Q-Factor HISPOL Quiz-6th April 2024, Quiz Club NITW
 
How to Fix XML SyntaxError in Odoo the 17
How to Fix XML SyntaxError in Odoo the 17How to Fix XML SyntaxError in Odoo the 17
How to Fix XML SyntaxError in Odoo the 17
 
Mythology Quiz-4th April 2024, Quiz Club NITW
Mythology Quiz-4th April 2024, Quiz Club NITWMythology Quiz-4th April 2024, Quiz Club NITW
Mythology Quiz-4th April 2024, Quiz Club NITW
 
Q-Factor General Quiz-7th April 2024, Quiz Club NITW
Q-Factor General Quiz-7th April 2024, Quiz Club NITWQ-Factor General Quiz-7th April 2024, Quiz Club NITW
Q-Factor General Quiz-7th April 2024, Quiz Club NITW
 
Expanded definition: technical and operational
Expanded definition: technical and operationalExpanded definition: technical and operational
Expanded definition: technical and operational
 
Team Lead Succeed – Helping you and your team achieve high-performance teamwo...
Team Lead Succeed – Helping you and your team achieve high-performance teamwo...Team Lead Succeed – Helping you and your team achieve high-performance teamwo...
Team Lead Succeed – Helping you and your team achieve high-performance teamwo...
 

Power System Analysis!

  • 1. POWER SYSTEM ANALYSIS UNIT I THE POWER SYSTEM – AN OVERVIEW AND MODELLING Structure of electric power system – Current scenario – Complex power – Concepts of real and reactive power – Per phase analysis – Modeling of generator, transformer with off-nominal tap ratio, transmission line – Per unit system – One-line, Impedance and reactance diagrams – Change of base – Primitive network and network matrices – Y-bus formulation by direct inspection and singular transformation methods. UNIT II POWER FLOW ANALYSIS System model – The power flow equations (PFE) – System variables – PFE in real form – Basic problems, modified specification – Bus classification – Solution technique – Gauss-seidel method – Newton-raphson method – Fast-decoupled method – Comparison of solution techniques. UNIT III SYMMETRICAL FAULT ANALYSIS Internal voltages of loaded machines under fault conditions – Balanced three phase fault – Fault calculations using bus impedance matrix – Algorithm for formation of the impedance matrix – Selection of circuit breakers. UNIT IV SYMMETRICAL COMPONENTS AND UNBALANCED FAULT ANALYSIS Symmetrical component analysis of unsymmetrical faults – LG – LL – LLG faults – Open conductor faults – Unbalanced fault analysis using bus impedance matrix. UNIT V POWER SYSTEM STABILITY Rotor dynamics and swing equation – Stability classification – Small signal stability – Large signal stability – Equal area criterion and solution of SMIB system problems – Solution of swing equation – Point-by-point method, R-K method and modified euler method – Techniques for stability improvement. L: 45 T: 15 Total: 60 TEXT BOOKS 1. Grainger, J.J. and William D. Stevenson Jr., “Power System Analysis”, Tata McGraw Hill,
  • 2. 2005. 2. Gupta, B.R., “Power System Analysis and Design” S.Chand and Co., Ltd, 2005. REFERENCES 1. Gupta, J.B., “A Course in Electrical Power”, S.K.Kataria and Sons, 2002. UNIT I THE POWER SYSTEM – AN OVERVIEW AND MODELLING Structure of electric power system – Current scenario – Complex power – Concepts of real and reactive power – Per phase analysis – Modeling of generator, transformer with off-nominal tap ratio, transmission line – Per unit system – One-line, Impedance and reactance diagrams – Change of base – Primitive network and network matrices – Y-bus formulation by direct inspection and singular transformation methods. Power system A Power system consists of Generation, Transmission and Distribution. Power system analysis The evaluation of power system is called as power system analysis Functions of power system analysis To monitor the voltage at various buses, real and reactive power flow between buses. To design the circuit breakers.
  • 3. To plan future expansion of the existing system To analyze the system under different fault conditions To study the ability of the system for small and large disturbances (Stability studies) Components of power system The components of power system are Generators, Power transformers, Transmission lines, Distribution lines, Loads and compensating devices like shunt, series, and static VAR compensator. Modern power system A modern power system can be subdivided into four major parts: Generation, Transmission and Sub transmission, Distribution and Loads. Per phase analysis. A balanced three phase system is always analyses on per phase basis by considering one of the three phase lines and neutral. Infinite bus bar A large system whose voltage and frequency remain constant, independent of the power exchange between synchronous machine and bus, and independent of the excitation of the synchronous machine. Single line diagram A single line diagram is diagrammatic representation of power system in which the components are represented by their symbols and interconnection between them are shown by a straight line9eventhough the system is three phase system0.The ratings and the impedances of the components are also marked on the single line diagram. Purpose of using single line diagram The purpose of the single line diagram is to supply in concise form of the significant information about the system. Impedance diagram & approximations made in impedance diagram The impedance diagram is the equivalent circuit of power system in which the various components of power system are represented by their approximate or simplified equivalent circuits. The impedance diagram is used for load flow studies. Approximation: (i) The neutral reactances are neglected. (ii) The shunt branches in equivalent circuit of transformers are neglected. Reactance diagram & approximations made in reactance diagram? The reactance diagram is the simplified equivalent circuit of power system in which the various components of power system are represented by their reactances. The reactance diagram can be obtained from impedance diagram if all the resistive components are neglected. The reactance diagram is used for fault calculations.
  • 4. Approximation: (i) The neutral reactances are neglected. (ii) The shunt branches in equivalent circuit of transformers are neglected. (iii) The resistances are neglected. (iv) All static loads are neglected. (v) The capacitance of transmission lines are neglected. Per unit value. The per unit value of any quantity is defined as the ratio of the actual value of the any quantity to the base value of the same quantity as a decimal. Advantages of per unit system i. Per unit data representation yields valuable relative magnitude information. ii. Circuit analysis of systems containing transformers of various transformation ratios is greatly simplified. iii. The p.u systems are ideal for the computerized analysis and simulation of complex power system problems. iv. Manufacturers usually specify the impedance values of equivalent in per unit of the equipments rating. If the any data is not available, it is easier to assume its per unit value than its numerical value. v. The ohmic values of impedances are refereed to secondary is different from the value as referee to primary. However, if base values are selected properly, the p.u impedance is the same on the two sides of the transformer. vi. The circuit laws are valid in p.u systems, and the power and voltages equations are simplified since the factors of √3 and 3 are eliminated. vii. Need for base values The components or various sections of power system may operate at different voltage and power levels. It will be convenient for analysis of power system if the voltage, power, current and impedance rating of components of power system are expressed with reference to a common value called base value. Equation for per unit impedance if change of base occurs. A generator rated at 30MVA, 11KV has a reactance of 20%.Calculate its per unit reactance for a base of 50 MVA and 10KV. MVA new = 50 ; KV new = 10 ; MVA old = 30 ; KV old = 11 X p.u = 20% = 20/100 = 0.2 p.u
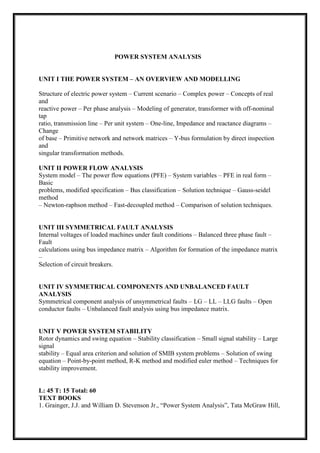
  • 5. New p.u impedance if the new base MVA is twice the old base MVA Draw the per unit reactance diagram for the power systems shown below. Neglect resistance and use a base of 100MVA, 220KV in 50 ohms line. The ratings of the generator, motor and transformers are G: 40MVA, 25KV, X’’ = 20% M: 50MVA, 11KV, X’’ = 30% T1: 40MVA, 33 Y/ 220Y KV, X = 15% T2: 30MVA, 11 Δ / 220Y KV, X = 15% Load: 11KV, 50MW+j68 MVAR Solution: Base MVA, MVAb, new = 100MVA Base KV, KVb, new = 220KV j 50Ω G1 M T1 T2
  • 6. Reactance of the transmission line: Actual reactance =50Ω Reactance of the Transformer T1: ; ; =? = 33 KV Reactance of the Generator G: ; ; = 33 Reactance of the Transformer T2: ; ; =?
  • 7. = 11 KV Reactance of the Motor M: ; ; = 11 Reactance Diagram 1. Draw the reactance diagram using a base of 50MVA and 13.8KV on generatorG1 j 0.287 j 0.375 j 0.1033 j 0.5 j 0.6 Eg Em G1 G3 G2 T1 T3 T2 Line 1 Line 2 j80Ω j100Ω
  • 8. G1: 20MVA, 13.8KV, X’’=20% ; G2: 30MVA, 18.0KV, X’’=20% G3: 30MVA, 20.0KV, X’’=20% ; T1: 25MVA, 220/13.8 KV, X =10% T2:3Single phase unit each rated 10MVA, 127/18 KV, X =10% T3: 35MVA, 220/22 KV, X =10% Solution: Base MVA, MVAb, new = 50MVA Base KV, KVb, new = 13.8KV Reactance of the Generator G1: ; ; = 13.8 Reactance of the Transformer T1 :( Primary side) ; ; = 13.8 Reactance of the transmission line j 80Ω: Actual reactance =80Ω
  • 9. = 220 KV Reactance of the transmission line j 100Ω: Actual reactance =100Ω = 220 KV Reactance of the Transformer T2:( Primary side) Connection; voltage rating: 220/18KV ; ; =220? Reactance of the Generator G2:
  • 10. ; ; = ? = 18KV Reactance of the Transformer T3 :( Secondary side) ; ; = 220 Reactance of the Generator G3: ; ; = ? = 22KV Reactance Diagram j 0.5 j 0.2 j 0.0826 j 0.1033 j 0.1667 j 0.333j 0.1429
  • 11. A simple power system is shown in fig. Redraw this system where the per unit impedance of the components are represented on a common 5000 VA base and common system base voltage of 250V. Solution: Base MVA, MVAb, new = 5000 VA = 5MVA Base KV, KVb, new = 250V = 0.25KV Impedance of the Generator G1: ; ; = 0.25 Impedance of the Generator G2: Z=40 + j 150Ω G1 T1 T2 G2 Load 1000VA 250V Z = j0.2 p.u 2000VA 250V Z = j0.3 p.u 4000VA 250/800V Z = j0.2 p.u 8000VA 1000/500V Z = j0.06 p.u 2500VA 400V
  • 12. ; ; = 0.25 Impedance of the Transformer T1: (Primary side) ; ; = 0.25 Impedance of the transmission line Z= 40+ j 100Ω: Actual impedance = (40+j150) Ω = 800 V Impedance of the Transformer T2: (Primary side) ; ; = 0.8 Impedance of the Load Reactance Diagram
  • 13. 2. The single line diagram of a three phase power system is shown in fig. Select a common base of 100MVA and 13.8KV on the generator side. Draw per unit impedance diagram G: 90MVA, 13.8KV, X=18% ; T1 :50MVA, 13.8/220KV, X=10% T2:50MVA, 220/11KV, X=10% ; T3 :50MVA, 13.8/132KV, X=10% T4:50MVA, 132/11KV, X=10% ; M : 80MVA, 10.45KV, X=20% LOAD : 57MVA, 0.8 p.f lagging at 10.45 KV ; Line 1 = j 50Ω ; Line 2 = j 70Ω Solution: Base MVA, MVAb, new = 100MVA Base KV, KVb, new = 13.8KV Reactance of the Generator G1: ; ; = 13.8 Reactance of the Transformer T1 :( Primary side) j 0.75 j 0.25 0.3125 + j 1.17 j 0.0585 j0.5 j 1.0 Load j 50Ω T1 T2 2 j70Ω G M T3 T4 4
  • 14. ; ; = 13.8 Reactance of the transmission line j 50Ω: Actual reactance =50Ω = 220 KV Reactance of the Transformer T2 :( Primary side) ; ; = 220 Reactance of the Transformer T3 :( Primary side) ;
  • 15. ; = 13.8 Reactance of the transmission line j 70Ω: Actual reactance =70Ω = 132KV Reactance of the Transformer T4 :( Primary side) ; ; = 132 Reactance of the Motor M: ; ; = ? = 11KV
  • 16. The load is at 0.8 p.f lagging is given by Load impedance is given by Base impedance for the load is Reactance Diagram
  • 17. Part-A 1. What is Power system? 2. What is power system analysis? 3. What are the functions of power system analysis? 4. What are the components of power system? 5. What is modern power system? 6. Define per phase analysis. 7. Draw the per phase model or equivalent circuit model or representation all components of power system? - 8. What is an infinite bus bar?. 9. What is single line diagram? 10. What is the purpose of using single line diagram? 11. What is impedance diagram? What are the approximations made in impedance diagram? 12. What is reactance diagram? What are the approximations made in reactance diagram? Part-B 1. Explain the modeling of generator, load, transmission line and transformer for power flow, short circuit and stability studies. 3. Draw the per unit reactance diagram for the power systems shown below. Neglect resistance and use a base of 100MVA, 220KV in 50 ohms line. The ratings of the generator, motor and transformers are Draw the reactance diagram using a base of 50MVA and 13.8KV on generatorG1 G1 G3 G2 T1 T3 T2 Line 1 Line 2 j80Ω j100Ω
  • 18. G1: 20MVA, 13.8KV, X’’=20% ; G2: 30MVA, 18.0KV, X’’=20% G3: 30MVA, 20.0KV, X’’=20% ; T1: 25MVA, 220/13.8 KV, X =10% T2:3Single phase unit each rated 10MVA, 127/18 KV, X =10% T3: 35MVA, 220/22 KV, X =10% 4. A simple power system is shown in fig. Redraw this system where the per unit impedance of the components are represented on a common 5000 VA base and common system base voltage of 250V. 1. The single line diagram of a three phase power system is shown in fig. Select a common base of 100MVA and 13.8KV on the generator side. Draw per unit impedance diagram G: 90MVA, 13.8KV, X=18% ; T1 :50MVA, 13.8/220KV, X=10% T2:50MVA, 220/11KV, X=10% ; T3 :50MVA, 13.8/132KV, X=10% T4:50MVA, 132/11KV, X=10% ; M : 80MVA, 10.45KV, X=20% Z=40 + j 150Ω G1 T1 T2 G2 Load 1000VA 250V Z = j0.2 p.u 2000VA 250V Z = j0.3 p.u 4000VA 250/800V Z = j0.2 p.u 8000VA 1000/500V Z = j0.06 p.u 2500VA 400V j 50Ω T1 T2 2 j70Ω G M T3 T4 4
  • 19. LOAD : 57MVA, 0.8 p.f lagging at 10.45 KV ; Line 1 = j 50Ω ; Line 2 = j 70Ω UNIT-II POWER FLOW ANALYSIS System model – The power flow equations (PFE) – System variables – PFE in real form – Basic problems, modified specification – Bus classification – Solution technique – Gauss-seidel method – Newton-raphson method – Fast-decoupled method – Comparison of solution techniques. Bus The meeting point of various components in a power system is called a bus. The bus is a conductor made of copper or aluminium having negligible resistance .At some of the buses power is being injected into the network, whereas at other buses it is being tapped by the system loads. Bus admittance matrix The matrix consisting of the self and mutual admittance of the network of the power system is called bus admittance matrix (Ybus). Methods available for forming bus admittance matrix Direct inspection method. Singular transformation method.(Primitive network) Power flow study or load flow study The study of various methods of solution to power system network is referred to as load flow study. The solution provides the voltages at various buses, power flowing in various lines and line losses. Information’s that are obtained from a load flow study The information obtained from a load flow study is magnitude and phase angle of voltages, real and reactive power flowing in each line and the line losses. The load flow solution also gives the initial conditions of the system when the transient behavior of the system is to be studied.
  • 20. Need for load flow study The load flow study of a power system is essential to decide the best operation of existing system and for planning the future expansion of the system. It is also essential foe designing a new power system. Quantities associated with each bus in a system Each bus in a power system is associated with four quantities and they are real power (P), reactive power (Q), magnitude of voltage (V), and phase angle of voltage (δ). Different types of buses in a power system, buses are classified and its types Types of bus Known or specified quantities Unknown quantities or quantities to be determined. Slack or Swing or Reference bus V, δ P,Q Generator or Voltage control or PV bus P, V Q, δ Load or PQ bus P, Q V, δ Need for slack bus The slack bus is needed to account for transmission line losses. In a power system the total power generated will be equal to sum of power consumed by loads and losses. In a power system only the generated power and load power are specified for buses. The slack bus is assumed to generate the power required for losses. Since the losses are unknown the real and reactive power are not specified for slack bus. Iterative methods to solve load flow problems The load flow equations are non linear algebraic equations and so explicit solution as not possible. The solution of non linear equations can be obtained only by iterative numerical techniques. Mainly used for solution of load flow study The Gauss seidal method, Newton Raphson method and Fast decouple methods. Flat voltage start
  • 21. In iterative method of load flow solution, the initial voltages of all buses except slack bus assumed as 1+j0 p.u. This is refereed to as flat voltage start Effect of acceleration factor in load flow study Acceleration factor is used in gauss seidal method of load flow solution to increase the rate of convergence. Best value of A.F=1.6 Generator buses are treated as load bus If the reactive power constraints of a generator bus violates the specified limits then the generator is treated as load bus. Advantages and disadvantages of Gauss serial method Advantages: Calculations are simple and so the programming task is lessees. The memory requirement is less. Useful for small systems; Disadvantages: Requires large no. of iterations to reach converge .Not suitable for large systems. Convergence time increases with size of the system Advantages and disadvantages of N.R method Advantages: Faster, more reliable and results are accurate, require less number of iterations; Disadvantages: Program is more complex, memory is more complex. Compare the Gauss seidel and Newton raphson methods of load flow study S.No G.S N.R FDLF 1 Require large number of iterations to reach convergence. Require less number of iterations to reach convergence. Require more number of iterations than N.R method. 2 Computation time per iteration is less Computation time per iteration is more Computation time per iteration is less 3 It has linear convergence characteristics It has quadratic convergence characteristics ------ 4 The number of iterations required for convergence increases with size of the system The number of iterations are independent of the size of the system The number of iterations are does not dependent of the size of the system 5 Less memory requirements. More memory requirements. Less memory requirements than N.R.method.
  • 22. Y matrix of the sample power system as shown in fig. Data for this system is given in table.
  • 23. Find out the Y matrix of the sample power system network diagram as shown in fig.
  • 24. Consider the system shown in fig. It shows a transmission network with impedance of transmission lines all in p.u as shown. Compute Ybus matrix. 0.02+j0.04 0.0125+j0.0250.01+j0.03 1 2 3
  • 25. y12 = 10 - j 20 y13 = 10 - j 30 y32 = 16 - j 32 Ybus = Gauss seidel load flow problem.
  • 26. The following is the system data for a load flow solution. Determine the voltages at the end of first iteration using Gauss-Seidel method. Take α=1.6 . The line admittances: Bus code Admittance 1-2 2-j8.0 1-3 1-j4.0 2-3 0.666-j2.664 2-4 1-j4.0
  • 27. 3-4 2-j8.0 The schedule of active and reactive powers: Bus code P in p.u Q in p.u V in p.u Remarks 1 - - 1.06 Slack 2 0.5 0.2 1+j0.0 PQ 3 0.4 0.3 1+j0.0 PQ 4 0.3 0.1 1+j0.0 PQ Solution = = = 1.01187-j0.02888 V2 1 acc = (1.0+j0.0)+1.6(1.01187-j0.02888-1.0-j0.0) = 1.01899-j0.046208 V3 1 = 0.994119-j0.029248 ; V3 1 acc = 0.99059-j0.0467968 V4 1 = 0.9716032-j0.064684 ; V4 1 acc = 0.954565-j0.1034944 Fig shows that the one line diagram of a simple three bus system with generation at bus 1.The magnitude of voltage at a bus 1 is adjusted to 1.05 p.u. The scheduled loads at buses2 and 3 are as marked on the diagram. Line impedances are marked in n p.u on a 100MVA base and the line charging susceptances are neglected. a. Using the Gauss-Seidel method, determine the phasor values of the voltages at the load buses 2 and 3(P-Q buses) accurate to decimal places. b. Find the slack bus real and reactive power. c. Determine the line flows and line losses. Construct a power flow diagram showing the direction of line flow.
  • 28. 1 0.02+j0.04 2 0.01+j0.03 0.0125+j0.025 Slack bus V1=1.05/_0º 138.6 45.2 MW MVAR 3 256.6MW 110.2MVAR
  • 29. Newton raphson seidel load flow problem.
  • 30.
  • 31.
  • 32.
  • 33.
  • 34.
  • 35.
  • 36.
  • 37. Fast decoupled load flow problem.
  • 38.
  • 39.
  • 40. Part-A 1. What is a bus? 2. What is bus admittance matrix? 3. What are the methods available for forming bus admittance matrix?
  • 41. 4. What is power flow study or load flow study? . 5. What are the informations that are obtained from a load flow study? 6. What is the need for load flow study? . 7. What are the quantities associated with each bus in a system? 8. What are the different types of buses in a power system? Or how the buses are classified and what are its types? 9. What is the need for slack bus? 10. Why do we go for iterative methods to solve load flow problems? 11. What are the methods mainly used for solution of load flow study? 12. What do you mean by a flat voltage start? 13. Discuss the effect of acceleration factor in load flow study. 14. When the generator buses are treated as load bus. Part-B 1. Find out the Y matrix of the sample power system as shown in fig. Data for this system is given in table. 1. 2. Find out the Y matrix of the sample power system network diagram as shown in fig.
  • 42. 3. Consider the system shown in fig. It shows a transmission network with impedance of transmission lines all in p.u as shown. Compute Ybus matrix. 0.02+j0.04 0.0125+j0.0250.01+j0.03 1 2 3
  • 43. UNIT-III SYMMETRICAL FAULT ANALYSIS Internal voltages of loaded machines under fault conditions – Balanced three phase fault – Fault calculations using bus impedance matrix – Algorithm for formation of the impedance matrix – Selection of circuit breakers. Fault A fault in a circuit is any failure which interferes with the normal flow of current. The faults are associated with abnormal change in current, voltage and frequency of the power system. Faults occur in a power system The faults occur in a power system due to Insulation failure of equipment Flashover of lines initiated by a lighting stroke Due to permanent damage to conductors and towers or due to accidental faulty operations. various types of faults (i) Series fault or open circuit fault One open conductor fault
  • 44. Two open conductor fault (ii) Shunt fault or short circuit fault. Symmetrical fault or balanced fault  Three phase fault Unsymmetrical fault or unbalanced fault  Line to ground (L-G) fault  Line to Line (L-L) fault  Double line to ground (L-L-G) fault Relative frequency of occurrence of various types of fault Types of fault Relative frequency of occurrence of faults Three phase fault 5% Double line to ground fault 10% Line to Line fault 15% Line to ground fault 70% . Symmetrical fault or balanced three phase fault This type of fault is defined as the simultaneous short circuit across all the three phases. It occurs infrequently, but it is the most severe type of fault encountered. Because the network is balanced, it is solved by per phase basis using Thevenins theorem or bus impedance matrix or KVL, KCL laws. Need for short circuit studies or fault analysis Short circuit studies are essential in order to design or develop the protective schemes for various parts of the system .To estimate the magnitude of fault current for the proper choice of circuit breaker and protective relays. Bolted fault or solid fault
  • 45. A Fault represents a structural network change equivalent with that caused by the addition of impedance at the place of a fault. If the fault impedance is zero, the fault is referred as bolted fault or solid fault. Reason for transients during short circuits The faults or short circuits are associated with sudden change in currents. Most of the components of the power system have inductive property which opposes any sudden change in currents, so the faults are associated with transients. Doubling effect If a symmetrical fault occurs when the voltage wave is going through zero then the maximum momentary short circuit current will be double the value of maximum symmetrical short circuit current. This effect is called doubling effect. DC off set current The unidirectional transient component of short circuit current is called DC off set current. Synchronous reactance or steady state condition reactance The synchronous reactance is the ratio of induced emf and the steady state rms current. It is the sum of leakage reactance (Xl) and the armature reactance (Xa). Sub transient reactance Fault
  • 46. The synchronous reactance is the ratio of induced emf on no load and the sub transient symmetrical rms current. Transient reactance The synchronous reactance is the ratio of induced emf on no load and the transient symmetrical rms current. short circuit capacity of power system or fault level. Short circuit capacity (SCC) or Short circuit MVA or fault level at a bus is defined as the product of the magnitude of the prefault bus voltage and the post fault current. SCC or Short circuit MVA = Or SCC = fault current in fig., if the prefault voltage at the fault point is 0.97 p.u. Fault Fault j0.15j0.15 j0.2 F
  • 47. j0.2 and j 0.15 are in series. j0.2+ j 0.15 = j 0.35 J0.35 is in parallel with j 0.15 = Bus impedance matrix Bus impedance matrix is the inverse of the bus admittance matrix. The matrix consisting of driving point impedance and transfer impedances of the network is called as bus impedance matrix. Bus impedance matrix is symmetrical. Methods available for forming bus impedance matrix Form bus admittance matrix and take the inverse to get bus impedance matrix. Using bus building algorithm. Using L-U factorization of Y-bus matrix. A synchronous generator and a synchronous motor each rated 20MVA, 12.66KV having 15% reactance are connected through transformers and a line as shown in fig. the transformers are rated 20MVA,12.66/66KV and 66/12.66KV with leakage reactance of 10% each. The line has a reactance of 8% on base of 20MVA, 66 KV. The motor is drawing 10MW at 0.8 leading power factors and a terminal voltage 11KV when symmetrical three phase fault occurs at the motors terminals. Determine the generator and motor currents. Also determine the fault current. Solution
  • 48. Reactance diagram Equivalent circuit during fault condition
  • 49. Three 11.2 KV generators are interconnected as shown in figure by a tie -bar through current limiting reactors. A three phase feeder is supplied from the bus bar of generator A at line voltage 11.2 KV. Impedance of the feeder is (0.12+j0.24) ohm per phase. Compute the maximum MVA that can be fed into a symmetrical short circuit at the far end of the feeder.
  • 50. Assume a zero pre-fault current (no load pre-fault condition).Circuit model for the fault calculation is given
  • 51. A 4 bus sample power system is shown in fig. Perform the short circuit analysis for a three phase solid fault on bus 4.data are given below G1: 11.2KV, 100MVA, X=0.08 p.u G1: 11.2KV, 100MVA, X=0.08 p.u T1: 11/110KV, 100MVA, X=0.06 p.u T2: 11/110KV, 100MVA, X=0.06 p.u Assume prefault voltages 1.0 p.u and prefault currents to be zero.
  • 52.
  • 53. Two generators G1 and G2 are rated 15MVA, 11KV and 10MVA, 11KV respectively. The generators are connected to a transformer as shown in fig. Calculate the subtaransient current in each generator when a three phase fault occurs on the high voltage side of the transformer.
  • 54. A radial power system network is shown in fig. a three phase balanced fault occurs at F. Determine the fault current and the line voltage at 11.8 KV bus under fault condition.
  • 55.
  • 56. A 100MVA,11KV generator with X’’=0.20 p.u is connected through a transformer and line to a bus bar that supplies three identical motor as shown in fig. and each motor has X’’=0.20 p.u and X’=0.25 p.u on a base of 20MVA,33KV.the bus voltage at the motors is 33KV when a three phase balanced fault occurs at the point F. Calculate (a) subtransient current in the fault (b) subtransient current in the circuit breaker B (c) Momentary current in the circuit breaker B (d) The current to be interrupted by CB B in (i) 2 cycles (ii) 3 cycles (iii) 5 cycles (iv) 8 cycles
  • 57.
  • 58.
  • 59. 1.
  • 60. Obtain impedance matrix ZBUS for shown in figure. Obtain impedance matrix ZBUS for shown in figure
  • 61.
  • 62. Part-A 1.What is meant by a fault? 2.How the faults are classified? 3.List the symmetrical and unsymmetrical faults. 4.Write the relative frequency of occurrence of various types of faults. 5.What is the need for short circuit studies or fault analysis? 6.What is meant by doubling effect? 7.What are the main factors to be considered to select a circuit breaker? 8.Define short circuit interrupting of a circuit breaker. 9.Write equation for subtransient internal voltage and transient internal voltage of motor and generator. 10.Find the momentary current through the circuit breaker if the initial symmetrical short circuit current through it is 5270.9A. Part-B 1). A synchronous generator and motor are rated for 30,000KVA,13.2KV and both have subtransient reactance of 20%.The line connecting them has a reactance of 10% on the base of machine ratings. The motor is drawing 20,000KW at 0.8 pf leading.The terminal voltage of the motor is 12.8KV.When a symmetrical three-phase fault occurs at motor terminals,find the subtransient current in generator,motor and at the fault point. (16) 2. Explain in detail about transients due to a short circuit in 3-Phase alternator and in transmission line. 3.) A 3-phase ,5MVA,6.6KV alternator with a reactance of 8% is connected to a feeder of series impedance of ).12+j0.48ohms/phase per km.The transformer is rated at 3MVA,6.6KV/33KV and has a reactance of 5%.Determine the fault current supplied by the generator operating under no-load with a voltage of 6.9 kv, when a 3-phase symmetrical fault occurs at a point 15km along the feeder. (16) ( (a)Explain in detail about bus impedance matrix in fault calculations (8). (b).Explain in detail about selection of circuit breakers. (8) 4) Explain about the symmetrical fault current estimation using kirchoff’s laws and using a Thevenin’s theorem. (7)
  • 63. 5. ) The bus impedance matrix of four bus system with values in p.u. is given by If a 3-phase fault occurs at bus-1when there is no-load,find the subtransient current in the fault and voltages at all buses.Also find the subtrasient current supplied by the generator connected to bus-2 by taking the subtransient reactance of generator as j0.2 p.u. UNIT- IV SYMMETRICAL COMPONENTS AND UNBALANCED FAULT ANALYSIS
  • 64. Symmetrical component analysis of unsymmetrical faults – LG – LL – LLG faults – Open conductor faults – Unbalanced fault analysis using bus impedance matrix. Symmetrical components of a 3 phase system In a 3 phase system, the unbalanced vectors (either currents or voltage) can be resolved into three balanced system of vectors. They are Positive sequence components Negative sequence components Zero sequence components Unsymmetrical fault analysis can be done by using symmetrical components. Positive sequence components It consists of three components of equal magnitude, displaced each other by 120˚ in phase and having the phase sequence abc . Negative sequence components It consists of three components of equal magnitude, displaced each other by 120˚ in phase and having the phase sequence acb . 120˚ 120˚ 120˚ Ia1 Ib1 Ic1
  • 65. Zero sequence components It consists of three phasors equal in magnitude and with zero phase displacement from each other. Sequence operator In unbalanced problem, to find the relationship between phase voltages and phase currents, we use sequence operator ‘a’. a = 1∠120˚ = = - 0.5+j0.866 Unbalanced currents from symmetrical currents Let, Ia, Ib, Ic be the unbalanced phase currents Let, Ia0, Ia1, Ia2 be the symmetrical components of phase a 120˚ 120˚ 120˚ Ia2 Ic2 Ib2 Ia0 Ib0 Ic0 Ia0 = Ib0 = Ic0
  • 66. Determination of symmetrical currents from unbalanced currents. Let, Ia, Ib, Ic be the unbalanced phase currents Let, Ia0, Ia1, Ia2 be the symmetrical components of phase a Sequence impedance and sequence network The sequence impedances are the impedances offered by the power system components or elements to +ve, -ve and zero sequence current. The single phase equivalent circuit of power system consisting of impedances to current of any one sequence only is called sequence network. The phase voltage across a certain load are given as
  • 67. Compute positive, negative and zero sequence component of voltage Solution: A balanced delta connected load is connected to a three phase system and supplied to it is a current of 15 amps. If the fuse is one of the lines melts, compute the symmetrical components of line currents. Draw zero sequence network of the power system as shown in fig.
  • 68. Draw zero sequence network of the power system as shown in fig. Draw zero sequence network of the power system as shown in fig. Data are given below.
  • 69. A 50MVA, 11KV, synchronous generator has a sub transient reactance of 20%.The generator supplies two motors over a transmission line with transformers at both ends as shown in fig. The motors have rated inputs of 30 and 15 MVA, both 10KV, with 25% sub transient reactance. The three phase transformers are both rated 60MVA, 10.8/121KV, with leakage reactance of 10% each. Assume zero sequence reactance for the generator and motors of 6% each. Current limiting reactors of 2.5 ohms each are connected in the neutral of the generator and motor number 2. The zero sequence reactance of the transmission line is 300 ohms. The series reactance of the line is 100 ohms. Draw the positive, negative and zero sequence networks.
  • 70.
  • 71. A 30 MVA, 13.2KV synchronous generator has a solidly grounded neutral. Its positive, negative and zero sequence impedances are 0.30, 0.40 and 0.05 p.u respectively. Determine the following: a) What value of reactance must be placed in the generator neutral so that the fault current for a line to ground fault of zero fault impedance shall not exceed the rated line current? b) What value of resistance in the neutral will serve the same purpose? c) What value of reactance must be placed in the neutral of the generator to restrict the fault current to ground to rated line current for a double line to ground fault? d) What will be the magnitudes of the line currents when the ground current is restricted as above? e) As the reactance in the neutral is indefinitely increased, what are the limiting values of the line currents?
  • 72. 2. Two alternators are operating in parallel and supplying a synchronous motor which is receiving 60MW power at 0.8 power factor lagging at 6.0 KV. Single line diagram for this system is given in fig. Data are given below. Compute the fault current when a single line to ground fault occurs at the middle of the line through a fault resistance of 4.033 ohm.
  • 73.
  • 74.
  • 75.
  • 76.
  • 77. Part-A 1.What are the symmetrical components of a 3 phase system? 2.What are the positive sequence components? 3.What are the negative sequence components? 4.What is sequence operator? 5.Write down the equations to convert symmetrical components into unbalanced phase currents. (Or) Determination of unbalanced currents from symmetrical currents. 6.Write down the equations to convert unbalanced phase currents into symmetrical components. (Or) Determination of symmetrical currents from unbalanced currents. .7What are sequence impedance and sequence network? .8.Draw the positive, negative and zero sequence network of all power system components. -- 9.Write the equation to determine fault current for L-G, L-L and L-L-G fault with impedance.
  • 78. 10.Draw the equivalent sequence network diagram for L-G, L-L and L-L-G fault . Part-B 1.A balanced delta connected load is connected to a three phase system and supplied to it is a current of 15 amps. If the fuse is one of the lines melts, compute the symmetrical components of line currents 2.Draw zero sequence network of the power system as shown in fig. 3.A 50MVA, 11KV, synchronous generator has a sub transient reactance of 20%.The generator supplies two motors over a transmission line with transformers at both ends as shown in fig. The motors have rated inputs of 30 and 15 MVA, both 10KV, with 25% sub transient reactance. The three phase transformers are both rated 60MVA, 10.8/121KV, with leakage reactance of 10% each. Assume zero sequence reactance for the generator and motors of 6% each. Current limiting reactors of 2.5 ohms each are connected in the neutral of the generator and motor number 2. The zero sequence reactance of the transmission line is 300 ohms. The series reactance of the line is 100 ohms. Draw the positive, negative and zero sequence networks.
  • 79. 4.A 30 MVA, 13.2KV synchronous generator has a solidly grounded neutral. Its positive, negative and zero sequence impedances are 0.30, 0.40 and 0.05 p.u respectively. Determine the following: f) What value of reactance must be placed in the generator neutral so that the fault current for a line to ground fault of zero fault impedance shall not exceed the rated line current? g) What value of resistance in the neutral will serve the same purpose? h) What value of reactance must be placed in the neutral of the generator to restrict the fault current to ground to rated line current for a double line to ground fault? i) What will be the magnitudes of the line currents when the ground current is restricted as above? j) As the reactance in the neutral is indefinitely increased, what are the limiting values of the line currents?
  • 80. UNIT- V POWER SYSTEM STABILITY Rotor dynamics and swing equation – Stability classification – Small signal stability – Large signal stability – Equal area criterion and solution of SMIB system problems – Solution of swing equation – Point-by-point method, R-K method and modified euler method – Techniques for stability improvement. power system stability The stability of an interconnected power system means is the ability of the power system is to return or regain to normal or stable operating condition after having been subjected to some form of disturbance. Power system stability is classified Rotor angle stability Rotor angle stability is the ability of interconnected synchronous machines of a power system to remain in synchronism.
  • 81. steady state stability Steady state stability is defined as the ability of the power system to bring it to a stable condition or remain in synchronism after a small disturbance. Steady state stability limit The steady sate stability limit is the maximum power that can be transferred by a machine to receiving system without loss of synchronism Transient stability Transient stability is defined as the ability of the power system to bring it to a stable condition or remain in synchronism after a large disturbance. transient stability limit The transient stability limit is the maximum power that can be transferred by a machine to a fault or a receiving system during a transient state without loss of synchronism. Transient stability limit is always less than steady state stability limit Dynamic stability It is the ability of a power system to remain in synchronism after the initial swing (transient stability period) until the system has settled down to the new steady state equilibrium condition Voltage stability It is the ability of a power system to maintain steady acceptable voltages at all buses in the system under normal operating conditions and after being subjected to a disturbance.
  • 82. Causes of voltage instability A system enters a state of voltage instability when a disturbance, increase in load demand, or change in system condition causes a progressive and uncontrollable drop in voltage The main factor causing instability is the inability of the power system to meet the demand for reactive power. Power angle equation and draw the power angle curve Where, P – Real Power in watts Vs – Sending end voltage; Vr- Receiving end voltage XT - Total reactance between sending end receiving end - Rotor angle. Maximum power transfer. Swing equation for a SMIB (Single machine connected to an infinite bus bar) system. M Where H = inertia constant in MW/MVA
  • 83. f = frequency in Hz M = inertia constant in p.u Swing curve The swing curve is the plot or graph between the power angle δ and time t. From the nature of variations of δ the stability of a system for any disturbance can be determined. 3 machine system having ratings G1, G2 and G3 and inertia constants M1, M2 and M3.What is the inertia constants M and H of the equivalent system. Where G1, G2, G3 – MVA rating of machines 1, 2, and 3 Gb = Base MVA or system MVA Assumptions made in stability studies. Machines represents by classical model The losses in the system are neglected (all resistance are neglected) The voltage behind transient reactance is assumed to remain constant. Controllers are not considered ( Shunt and series capacitor ) Effect of damper winding is neglected. Equal Area Criterion The equal area criterion for stability states that the system is stable if the area under P – δ curve reduces to zero at some value of δ.
  • 84. This is possible if the positive (accelerating) area under P – δ curve is equal to the negative (decelerating) area under P – δ curve for a finite change in δ. hence stability criterion is called equal area criterion. Critical clearing angle. The critical clearing angle , is the maximum allowable change in the power angle δ before clearing the fault, without loss of synchronism. The time corresponding to this angle is called critical clearing time, .It can be defined as the maximum time delay that can be allowed to clear a fault without loss of synchronism. Methods of improving the transient stability limit of a power system. Reduction in system transfer reactance Increase of system voltage and use AVR Use of high speed excitation systems Use of high speed reclosing breakers Numerical integration methods of power system stability i. Point by point method or step by step method ii. Euler method iii. Modified Euler method iv. Runge-Kutta method(R-K method)
  • 85. swing equation for a single machine connected to infinite bus system.
  • 86. A 400 MVA synchronous machine has H1=4.6 MJ/MVA and a 1200 MVA machines H2=3.0 MJ/MVA. Two machines operate in parallel in a power plant. Find out Heq relative to a 100MVA base.
  • 87. A 100 MVA, two pole, 50Hz generator has moment of inertia 40 x 103 kg-m2 .what is the energy stored in the rotor at the rated speed? What is the corresponding angular momentum? Determine the inertia constant h. The sending end and receiving end voltages of a three phase transmission line at a 200MW load are equal at 230KV.The per phase line impedance is j14 ohm. Calculate the maximum steady state power that can be transmitted over the line.
  • 88. Equal area criterion in transient stability.
  • 89. A single line diagram of a system is shown in fig. All the values are in per unit on a common base. The power delivered into bus 2 is 1.0 p.u at 0.80 power factor lagging. Obtain the power angle equation and the swing equation for the system. Neglect all losses.
  • 90.
  • 91. Explain critical clearing angle and critical clearing time in transient stability.
  • 92.
  • 93.
  • 94. A 50Hz synchronous generator capable of supplying 400MW of power is connected to a larger power system and is delivering 80MW when a three phase fault occurs at its terminals, determine (a) the time in which the fault must be cleared if the maximum power angle is to be -85˚ assume H=7MJ/MVA on a 100MVA base (b) the critical clearing angle.
  • 95. A 2220 MVA, 24KV and 60 Hz synchronous machine is connected to an infinite bus through transformer and double circuit transmission line, as shown in fig. The infinite bus voltage V=1.0 p.u .The direct axis transient reactance of the machine is 0.30 p.u, the transformer reactance is 0.20 p.u, and the reactance of each the transmission line is 0.3 p.u,all to a base of the rating of the synchronous machine. Initially, the machine is delivering 0.8 p.u real power and reactive power is 0.074 p.u with a terminal voltage of 1.0 p.u. The inertia constant H=5MJ/MVA. All resistances are neglected. A three phase fault occurs at the sending end of one of the lines, the fault is cleared, and the faulted line is isolated. Determine the critical clearing angle and the critical fault clearing time. The current flowing into the infinite bus is The transfer reactance between internal voltage and the infinite bus before fault is X = Xg +XT +Xtr.line X = 0.3 + 0.2 +0.3/2 = 0.65 The transient internal voltage is
  • 96. E = V +j X I = 1.0+ (j0.65) (0.8- j0.074) = 1.17 Since both lines are intact when the fault is cleared, the power angle equation before and after the fault is The initial operating angle is given by = 0.8 δ0 = 26.388 = 0.46055 rad δmax =180º - δ0 = 153.612 =2.681rad Critical clearing angle δc = Critical clearing time tc = = = 0.26 second A synchronous generator is connected to a large power system and supplying 0.45 pu MW of its maximum power capacity. A three phase fault occurs and the effective terminal voltage of the generator becomes 25% of its value before the fault. When the fault is cleared, generator is delivering 70% of the original maximum value. Determine the critical clearing angle.
  • 97. Find the critical clearing angle of the power system shown in fig. for a three phase fault at the point F. Generator is supplying 1.0 p.u MW power under pre-fault condition.
  • 98.
  • 99.
  • 100. Factors influencing transient stability Numerical integration methods of power system stability? Explain any one methods. v. Point by point method or step by step method vi. Euler method vii. Modified Euler method viii. Runge-Kutta method(R-K method)
  • 101. Step by step method
  • 102.
  • 103.
  • 104. Part-A 1What is power system stability? 2.How power system stability is classified? 3.What is rotor angle stability? 4.What is steady state stability? 5.What is steady state stability limit? 6.What is transient stability? 7.What is transient stability limit? 8.What is dynamic stability? 9.What is voltage stability? 10.State the causes of voltage instability. . 11.Write the power angle equation and draw the power angle curve. Part-B 1.Derive swing equation for a single machine connected to infinite bus system 1. A 400 MVA synchronous machine has H1=4.6 MJ/MVA and a 1200 MVA machines H2=3.0 MJ/MVA. Two machines operate in parallel in a power plant. Find out Heq relative to a 100MVA base. 2. A 100 MVA, two pole, 50Hz generator has moment of inertia 40 x 103 kg- m2 .what is the energy stored in the rotor at the rated speed? What is the corresponding angular momentum? Determine the inertia constant h 3. The sending end and receiving end voltages of a three phase transmission line at a 200MW load are equal at 230KV.The per phase line impedance is j14 ohm. Calculate the maximum steady state power that can be transmitted over the line.