Impact of Earthquaker Duration on Bridge Performance
•
1 gostou•435 visualizações

Autor: David Howard Sanders Fecha: 2017/11/09

Recomendados
Recomendados
Mais conteúdo relacionado
Mais procurados
Mais procurados (19)
Semelhante a Impact of Earthquaker Duration on Bridge Performance
Semelhante a Impact of Earthquaker Duration on Bridge Performance (20)
Mais de Academia de Ingeniería de México
Mais de Academia de Ingeniería de México (20)
Último
Último (20)
Impact of Earthquaker Duration on Bridge Performance
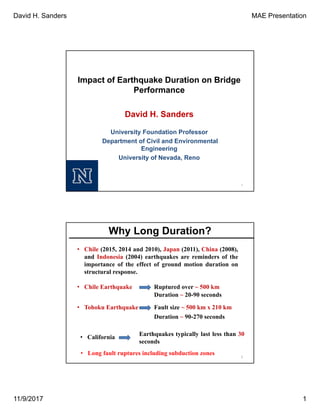
- 1. David H. Sanders MAE Presentation 11/9/2017 1 Impact of Earthquake Duration on Bridge Performance 1 David H. Sanders University Foundation Professor Department of Civil and Environmental Engineering University of Nevada, Reno 2 • Chile (2015, 2014 and 2010), Japan (2011), China (2008), and Indonesia (2004) earthquakes are reminders of the importance of the effect of ground motion duration on structural response. • Long fault ruptures including subduction zones • Chile Earthquake Ruptured over ~ 500 km Duration ~ 20-90 seconds • Tohoku Earthquake Fault size ~ 500 km x 210 km Duration ~ 90-270 seconds Earthquakes typically last less than 30 seconds Why Long Duration? • California
- 2. David H. Sanders MAE Presentation 11/9/2017 2 Ground Motion Duration Definitions 3 Arias Intensity=∫a2.dt • Significant Duration (5‐95% of the Arias Intensity) Recommended by Jack Baker and Greg Deierlein (2012) Vu and Saiidi (2005) Rinaldi -1/3 scale • Design Code: AASHTO • L/D= 4.5 (flexural control) Target Displacement demands for our tests (50%) 4 9.8 in. Specimen Design/Pre-test Analysis
- 3. David H. Sanders MAE Presentation 11/9/2017 3 Specimen Design/Pre-test Analysis 5 - OpenSees model was used to simulate Vu and Saiidi’s Column - Selection of the motions was based on this model (the displacement demands to be around half the capacity) -80 long-duration ground motions from Japan 2011 and Chile 2010 were used in the pre-test analysis 6 Damage Prediction Before Testing Modified Park-Ang damage index was used to quantify the damage •δ max = Maximum displacement demand during the ground motion •δ u =Ultimate displacement capacity (taken 9.8 in. from Vu and Saiidi’s test) •β = Constant (taken 0.15 for concrete structures) •Eh = Hysteretic energy •Fy = Yield force
- 4. David H. Sanders MAE Presentation 11/9/2017 4 Modified Park-Ang damage index was used to quantify the damage Data from past shake-table and cyclic load tests on seismically designed bridge columns (about 25 models) were used to correlate the damage index with different damage states. Experimental Fragility Curves 0 10 20 30 40 50 60 70 80 90 100 0 0.5 1 1.5 2 2.5 3 3.5 Probabilityofexceedinga damagestate(%) DI (Park and Ang.) Minor Spalling Extensive Spalling Exposed Reinforcement Bar Buckling Bar Fracture ‐Example: Run #, DI=1.5 1.5 7 40% Bar Buckling 0% Bar Fracture 90% Exposed RFT. Damage Prediction Before Testing 8 Japan Long-dur. Loma Prieta Short-dur. Japan Long-dur. 0 0.5 1 1.5 2 2.5 3 0 1 2 3 4 SpectralAcceleration(g) Period (sec.) Crescent City, CA (2475 years) FKSH20 N-S (Original) FKSH20 N-S (Modified) Column LD-J1 (Long-Duration) Japan 0 0.5 1 1.5 2 2.5 3 3.5 0 1 2 3 4 SpectralAcceleration(g) Period (sec.) Seattle, WA Port Angeles, WA Newport, OR Crescent City, CA Eureka, CA 2475 yr return period Selected Spectral Matching 0 0.5 1 1.5 2 2.5 0 1 2 3 4 SpectralAcceleration(g) Period (sec.) Crescent City, CA (2475 years) MYG006 E-W (Original) Initial Period Shake Table Tests
- 5. David H. Sanders MAE Presentation 11/9/2017 5 9 Japan Long-dur. Loma Prieta Short-dur. -0.8 -0.6 -0.4 -0.2 0 0.2 0.4 0.6 0.8 0 50 100 150 200 250 Acceleration(g) Time (sec.) Ds (5-95%) = 88 sec. -0.8 -0.6 -0.4 -0.2 0 0.2 0.4 0.6 0.8 0 50 100 150 200 250 Acceleration(g) Time (sec.) Ds (5-95%) = 9 sec. 0 0.5 1 1.5 2 2.5 0 1 2 3 4 Acceleration(g) Period (sec.) Japan Short Design codes These motions are the same Japan Long-dur. Shake Table Tests 10 Axial Load Mass Rig System Lateral Load cell Axial Load Rigid frame String pots Shake table Specimen Shake Table Tests
- 6. David H. Sanders MAE Presentation 11/9/2017 6 11 Mass Rig Shake Table Rigid Frame Axial Load Shake Table Tests 12 100% of GM + AfterShock + 125% of GM + 150% of GM + etc… (Until Failure) Loading Protocol
- 7. David H. Sanders MAE Presentation 11/9/2017 7 13 Max. Disp.= 4.5” Max. Disp.= 3.88” South • 4.4” spalling • Spirals Exposed North • 3.0” spalling • Spirals Exposed South • Cracks (max width= 0.4mm) North • 4.5” spalling • No RFT. Exposed Column 1 (Japan- Long Dur.) Column 2 (Short-duration) 100 % of the Ground Motion Max. Disp.= 4.7” South North • Minor spalling • No RFT. Exposed Column 3 (Japan – Long Dur.) • 7.5” spalling • Spirals Exposed 14 Max. Disp.= 4.98” Max. Disp.= 4.8” South North South North Column 1 (Japan- Long Dur.) Column 2 (Short-duration) Max. Disp.= 7.38” South North Column 3 (Japan – Long Dur.) • 8.5” spalling • 4 Bars fractured • 6.4” spalling • Core Damage • 4.5” spalling • Spirals exposed • 4.5” spalling • Spirals exposed • 8.0” spalling • 3 Bars buckled • 5” spalling • 1 Bar fractured 125 % of the Ground Motion
- 8. David H. Sanders MAE Presentation 11/9/2017 8 15 Max. Disp.= 4.98” Max. Disp.= 4.8” South North South North Column 1 (Japan- Long Dur.) Column 2 (Short-duration) Max. Disp.= 7.38” South North Column 3 (Japan – Long Dur.) • 8.5” spalling • 4 Bars fractured • 6.4” spalling • Core Damage • 4.5” spalling • Spirals exposed • 4.5” spalling • Spirals exposed • 8.0” spalling • 3 Bars buckled • 5” spalling • 1 Bar fractured -4 -2 0 2 4 6 8 350 400 450 500 550 Displacement(in.) + 7.38 in. - 2.3 in. Bar FractureA Column 3 125 % of the Ground Motion 16
- 9. David H. Sanders MAE Presentation 11/9/2017 9 17 Column 1 (Japan- Long Dur.) Column 2 (Short-duration) Column 4 (Japan – Long Dur.) Max. Disp.= 7.3” South North • 6” spalling • Spirals exposed • 9” spalling • Spirals exposed NotApplicable BarsFracturedat 125% Max. Disp.= 4.98” NotApplicable BarsFracturedat 125% Max. Disp.= 7.38” 150 % of the Ground Motion 18 Column 1 (Japan- Long Dur.) Column 2 (Short-duration) Column 4 (Japan – Long Dur.) Max. Disp.= 9.22” NotApplicable BarsFracturedat 125% Max. Disp.= 4.98” NotApplicable BarsFracturedat 125% Max. Disp.= 7.38” South North • 1 bar fractured • 2 bars buckled • 4 bars buckled 175 % of the Ground Motion
- 10. David H. Sanders MAE Presentation 11/9/2017 10 19 Force Displacement 20 Short-Duration Long-Duration (Japan-1) Long-Duration (Japan 2) Strain History
- 11. David H. Sanders MAE Presentation 11/9/2017 11 21 Column LD-J1 (Japan-125%) Column SD-L (Short-175%) Spectral Acceleration at Final Damage State 22 ‐Concrete01 with STC ‐Steel02 ‐Wehbe’s method for bond slip 0 20 40 60 80 100 0 0.5 1 1.5 2 2.5 3 3.5 4 4.5 Probabilityofexceedinga damagestate(%) DI (Park and Ang.) Minor Spalling (M.S.) Extensive Spalling (E.S.) Exposed Reinforcement (E.R.) Bar Buckling (B.B.) Bar Fracture (B.F.) 50 % probability Post-Test Analysis
- 12. David H. Sanders MAE Presentation 11/9/2017 12 23 Incremental Dynamic Analysis (IDA) 0 10 20 30 40 50 60 70 80 90 100 0 5 10 15 ProbabilityofCollapse(%) Could be any INDEX OpenSees Model # Long-Duration Short-Duration Set A - Example on how the comparative collapse fragility curves look like - Each point represents a ground motion that was scaled until failure Post-Test Analysis 672 total motions that were scaled until collapse 24 Maximum Displacement Comparative Collapse Analysis (Collapse Fragility Curves) Post-Test Analysis
- 13. David H. Sanders MAE Presentation 11/9/2017 13 25 Spectral Acceleration Comparative Collapse Analysis (Collapse Fragility Curves) Post-Test Analysis Conclusions 26 1) Ground motion duration has a significant effect on the collapse capacity of bridge columns. 3) A significant reduction in the spectral accelerations at collapse in case of long duration motions with respect to the short duration motions. 2) A significant reduction in the displacement capacity was observed in case of long duration motions compared to the short duration motions for both the experimental and analytical studies. Approximate reduction of about 25% Approximate reduction of about 20% 4) Ground motion duration is an important parameter when selecting ground motions for nonlinear analysis of structures.
- 14. David H. Sanders MAE Presentation 11/9/2017 14 Rapid Construction By using precast components to accelerate the onsite construction I5, Grand Mound Bridge Replacement Project, 2012 (Khaleghi et al. 2012) 27 By using pretensioned rocking columns to reduce the residual displacements and to mitigate earthquake damage Resilient Bridge Using Conventional Materials ReinforcingSteel SteelTubes Strands Grout Concrete 28Faster Construction and Better Seismic Performance-You Can Have Both Shape Memory Alloys (SMA) Engineered Cementious Composites (ECC) Resiliency
- 15. David H. Sanders MAE Presentation 11/9/2017 15 System Development 29 Damage Mitigation 1- By confining the end of the columns to reduce the damage to concrete 2- By debonding the longitudinal reinforcement at critical zones to control the fracture of the longitudinal bars ConfiningTube DebondedBars 30
- 16. David H. Sanders MAE Presentation 11/9/2017 16 + = Moment-Rotation Strand Rebar Total 31 System Development Moment-Rotation Strand Rebar Total + = 32 System Development
- 17. David H. Sanders MAE Presentation 11/9/2017 17 Moment-Rotation Strand Rebar Total + = 33 System Development Moment-Rotation Strand Rebar Total + = 34 System Development
- 18. David H. Sanders MAE Presentation 11/9/2017 18 Moment-Rotation Strand Rebar Total + = 35 System Development Moment-Rotation Strand Rebar Total + = 36 System Development
- 19. David H. Sanders MAE Presentation 11/9/2017 19 Moment-Rotation Strand Rebar Total + = 37 System Development 38 Bridge Description
- 20. David H. Sanders MAE Presentation 11/9/2017 20 39 Column Description 40 Bridge Construction
- 21. David H. Sanders MAE Presentation 11/9/2017 21 1- N-S component Century City Country Club North (CCN) station 1994 Northridge California Earthquake 2-N-S components Sylmar- Olive View Med. Center (SYL) 1994 Northridge California Earthquake 3-N-S component Takatori (TAK) record 1995 Kobe, Japan Earthquake Motion Record PGA (g) Design Level (%) 14A CCN 0.25 33% 14B1 SYL 0.20 - 14B2 SYL 0.40 - 14C TAK 0.25 - 15 CCN 0.50 67% 16 CCN 0.75 100% 17 CCN 1.00 133% 18 CCN 1.33 177% 19 CCN 1.66 221% 20A CCN 0.75 100% 20B SYL 0.843 - 21A TAK 0.40 - 21B TAK 0.611 - 21C TAK 0.80 - 41 Ground Motions 42 Ground Motions
- 22. David H. Sanders MAE Presentation 11/9/2017 22 Conventional Bridge Motion 19 (221%DE) Resilient vs Conventional 43 Resilient Bridge Motion 19 (221%DE) 44 Resilient vs Conventional
- 23. David H. Sanders MAE Presentation 11/9/2017 23 Behavior Comparison (Mantawy et al. 2016) 45 Resilient vs Conventional Damage Comparison (Mantawy et al. 2016) 46 Resilient vs Conventional
- 24. David H. Sanders MAE Presentation 11/9/2017 24 Damage Evaluation 47 Bar fracture occurred but after the design level earthquake. (133%) Fracture of Reinforcing Bars Motion 17 18 19 20A 20B 21A 21B 21C Total # of Fractures 1 24 29 5 5 0 1 5 70 Method 1:Fracture Estimation by Acoustic Emissions 48
- 25. David H. Sanders MAE Presentation 11/9/2017 25 Fracture of Reinforcing Bars 1- Bar buckling in the columns was inhibited by a confining tube detail; 2- Strains in the reinforcement were distributed over deliberately debonded length; 3- All 72 of the column’s longitudinal reinforcement fractured during testing; and 4- Because the system deformed by rocking, the strain response histories could be calculated from the measured rotations at columns’ ends after the deformation capacities of the strain gauges were exceeded. Method 2:Fracture Estimation by Connection Rotation 49 Method 2: Fracture Estimation by Connection Rotation 50 Fracture of Reinforcing Bars
- 26. David H. Sanders MAE Presentation 11/9/2017 26 Numerical Model Development 51 Method 3:Fracture Estimation by Low Cycle Fatigue Model 52 Numerical Model Development
- 27. David H. Sanders MAE Presentation 11/9/2017 27 Numerical Model Assessment 53 Fracture Excluded Motion 20B (SLY 0.834 g) 54 Fracture Included Motion 20B (SLY 0.834 g) Numerical Model Assessment
- 28. David H. Sanders MAE Presentation 11/9/2017 28 Total Base Shear Envelope 55 COM Displacement during Motion 19 (221%DE) Numerical Model Assessment v v 56 Number of Fractured Bars Numerical Model Assessment
- 29. David H. Sanders MAE Presentation 11/9/2017 29 Parametric Studies Using CCN Motion 125%, 150%, and 175% DE Bent Height and Column Diameter Steel Ratio, Strand Ratio and Initial Pretensioning Bar Size - #6, #7, #8 Unbonded Length of conventional reinforcement What is the impact of configuration on facture and can the unbonded length of conventional reinforcement delay fracture? Impact of Debonding 58 Debonding the longitudinal steel at the rocking interfaces in the column, using 24 times bar diameter was effective to delay the fracture of longitudinal bars during the Design Level Earthquake while keeping residual displacement low.
- 30. David H. Sanders MAE Presentation 11/9/2017 30 Conclusions 1- The precast system enables the bridge bents to be built faster in the field than conventional construction. 2- The system used conventional technologies while mitigating damage such as: • Confining steel tubes at the ends of the columns mitigate the damage of concrete and eliminate the buckling of longitudinal reinforcement. • Debonding delayed yielding and bar facture. • Rocking system was effective at keeping residual displacement low. 59 The impact of earthquake duration can be significant through increased strain history, decreased displacement capacity, and increased chance of bar fracture. 60 Conclusions
- 31. David H. Sanders MAE Presentation 11/9/2017 31 Thank you! This is great honor and very much appreciated. 61